Pseudoproxy modelling of uncertainties in palaeoecological data.
University of Auckland, UW-Madison
12/8/22
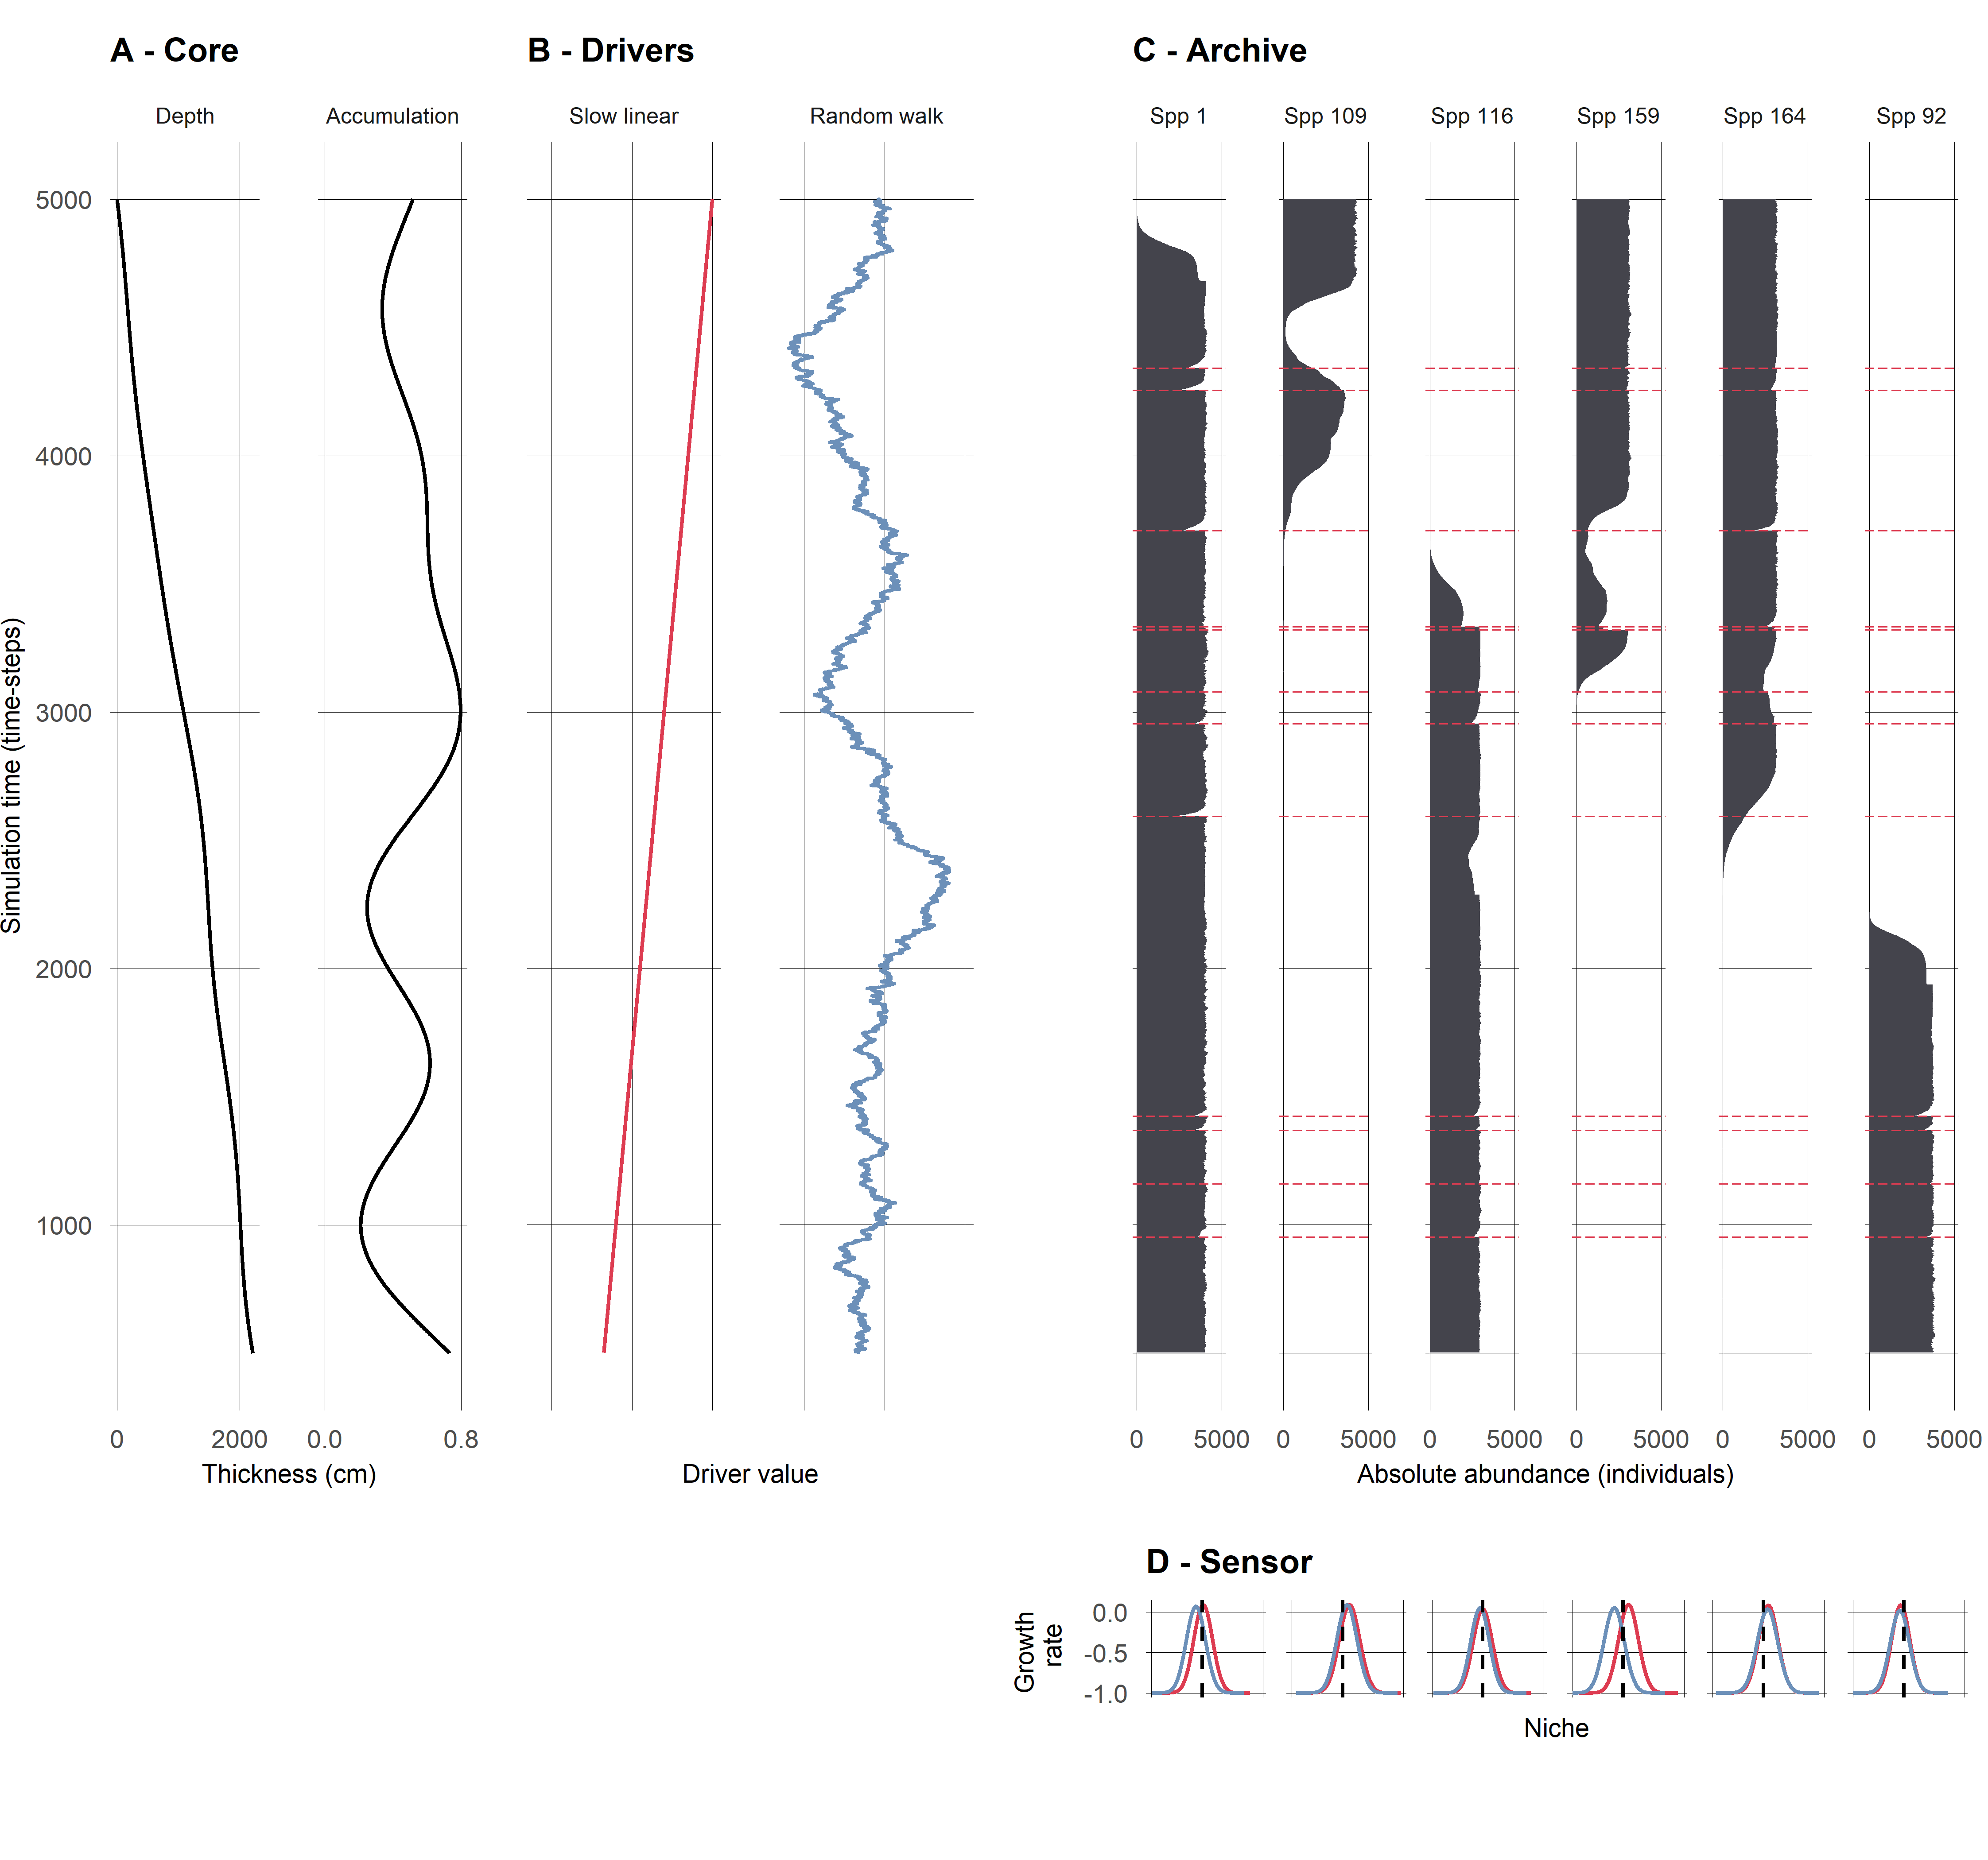
Proxy system modelling
Describes the process by which environmental change is recorded as an observable signal in an archive:
environmental drivers (e.g., climatic variability)
a sensor (a physical, biological or chemical component of the system that responds to the environmental drivers)
an archive (the medium in which the response of the sensor is recorded such as a lake sediment)
observations drawn from the archive
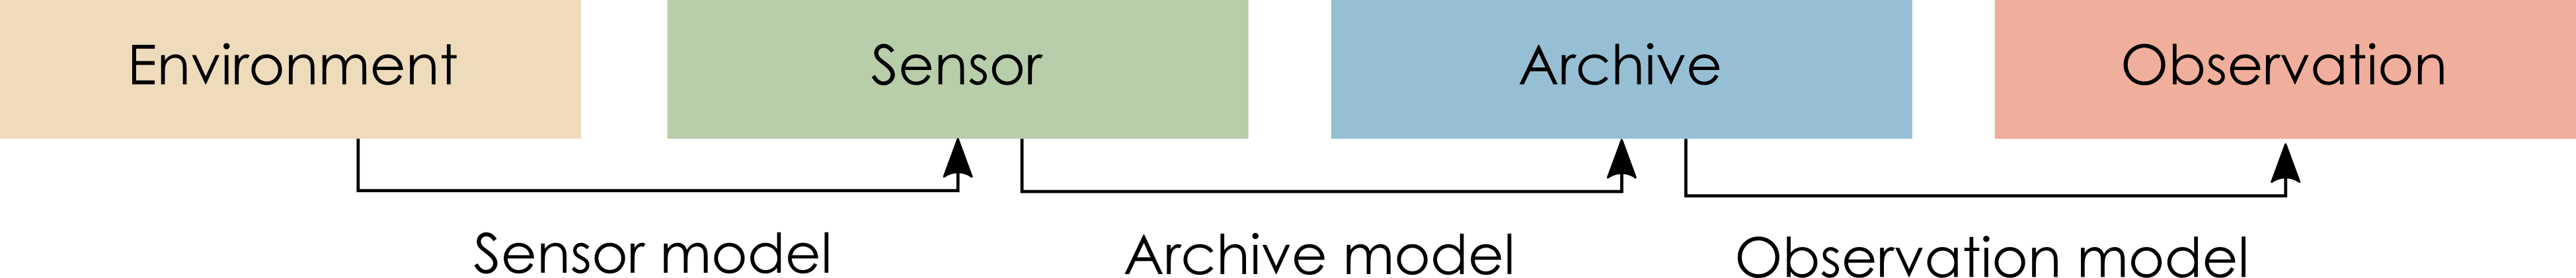
Proxy Ststem Modelling framework, from Evans et al. (2013)
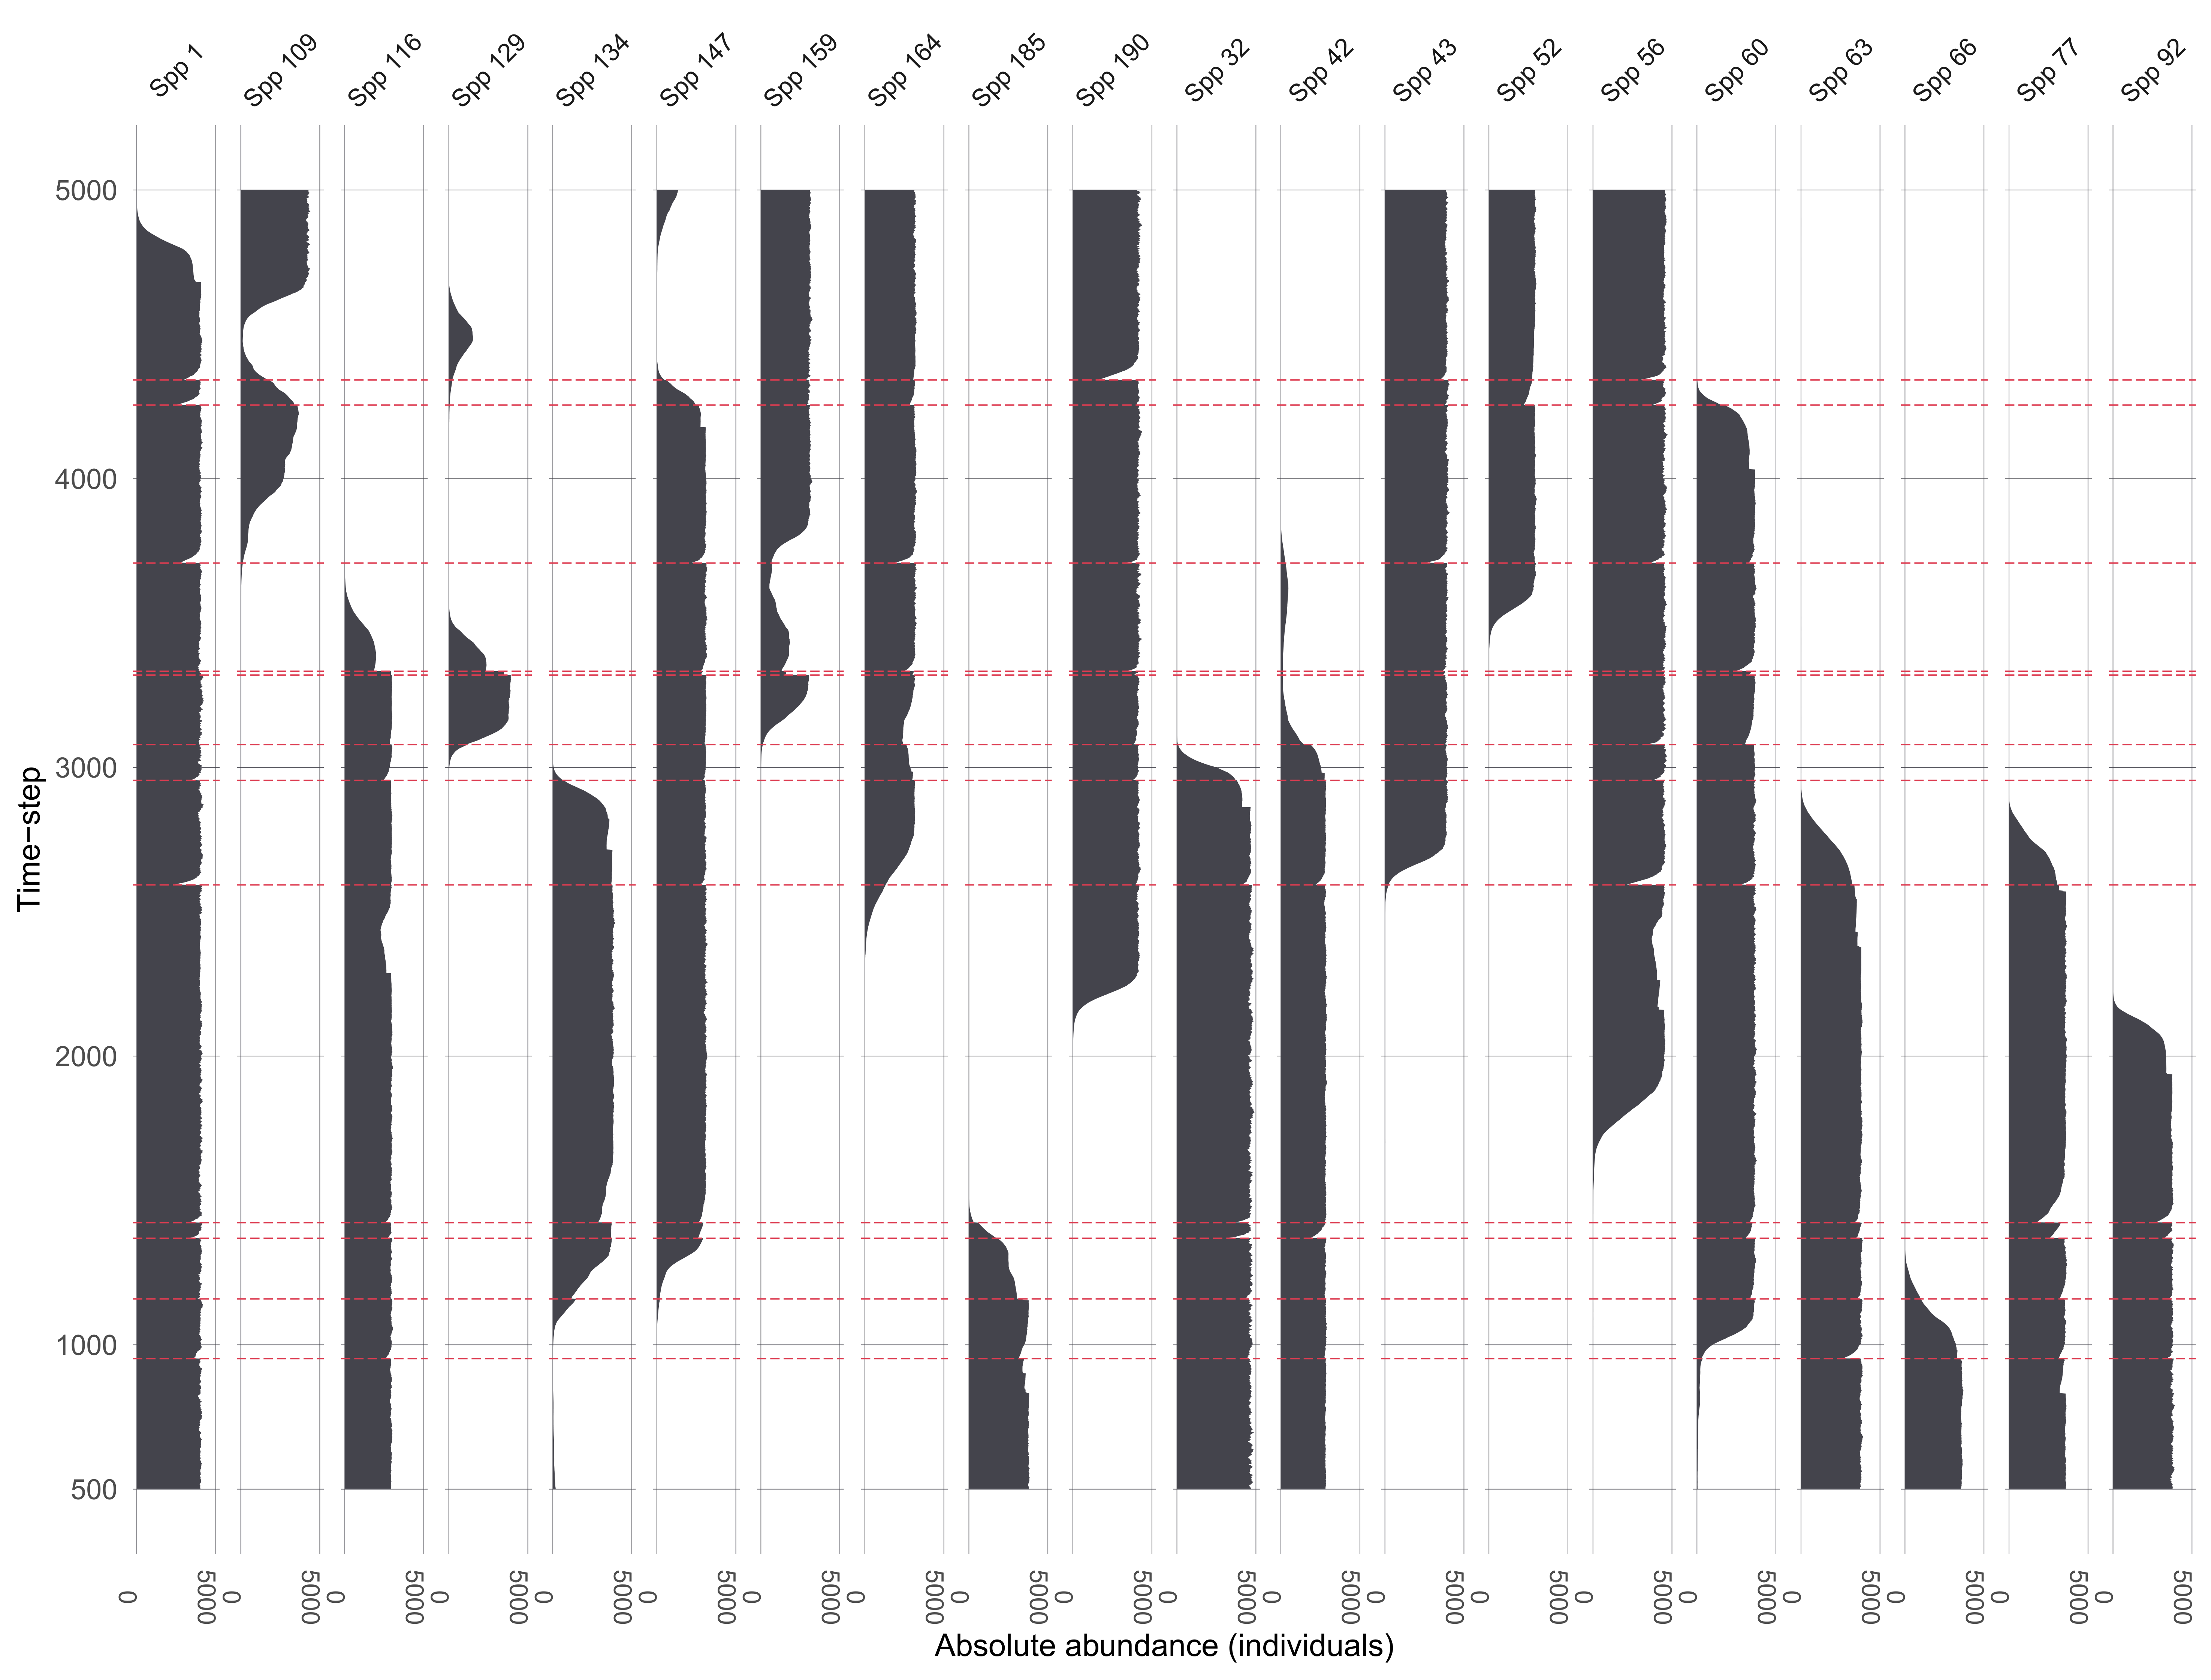
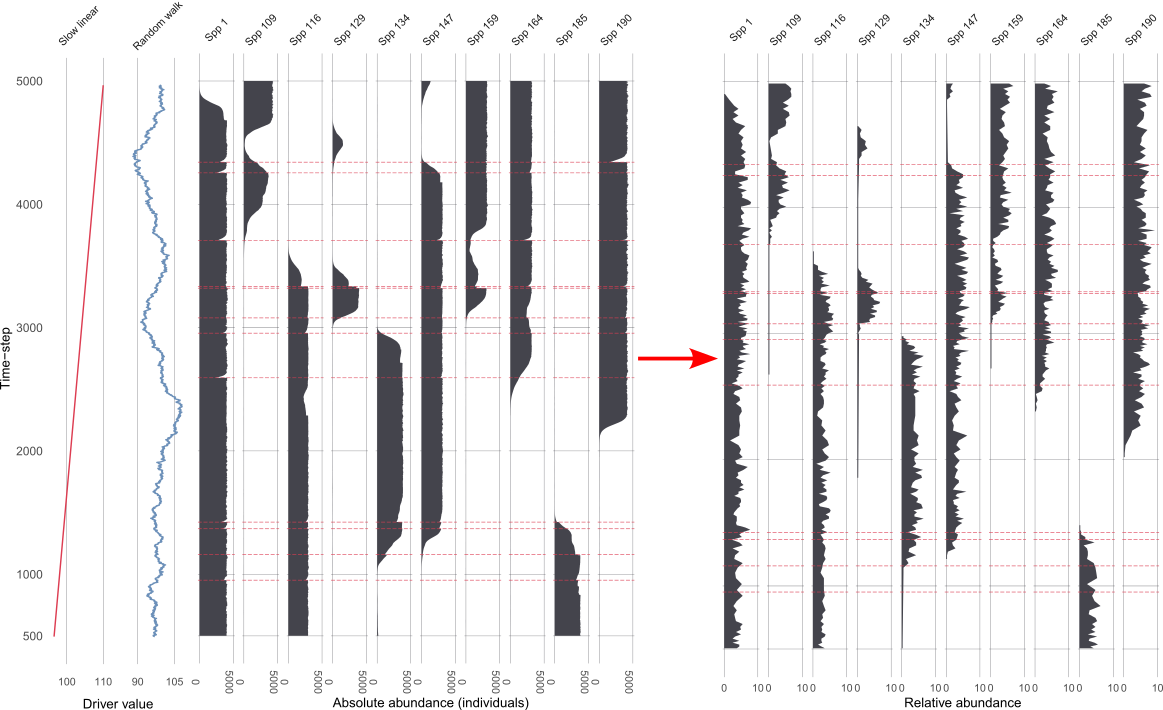
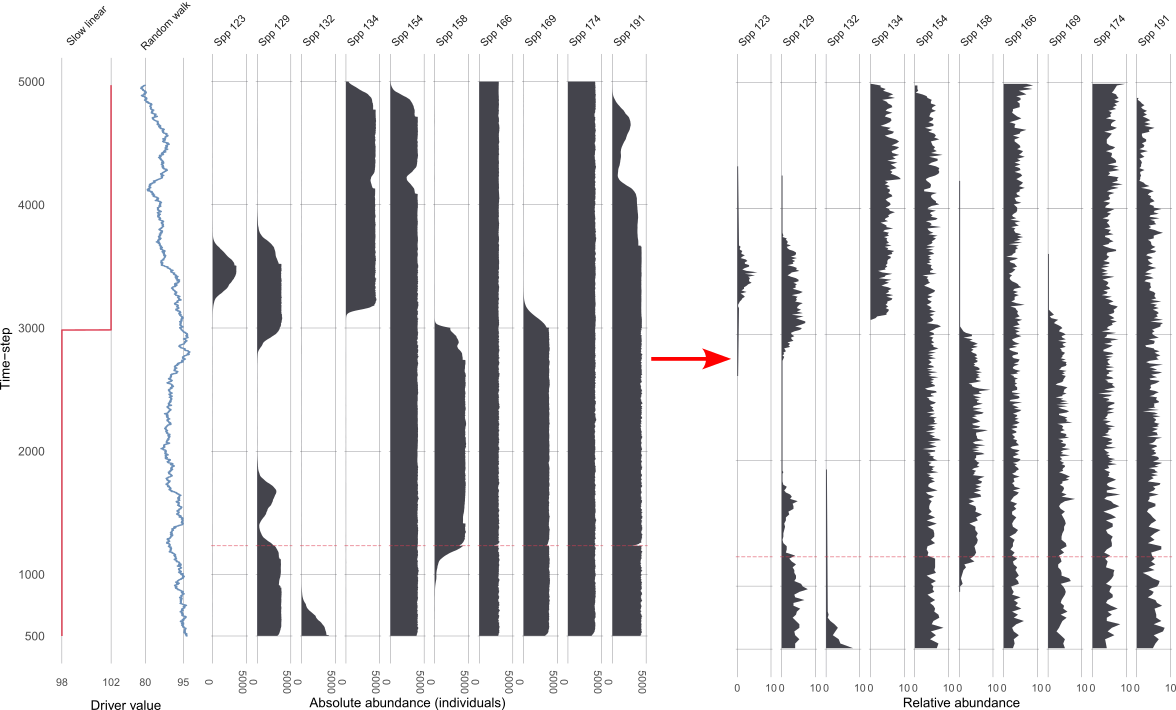
Simulating pseudoproxies
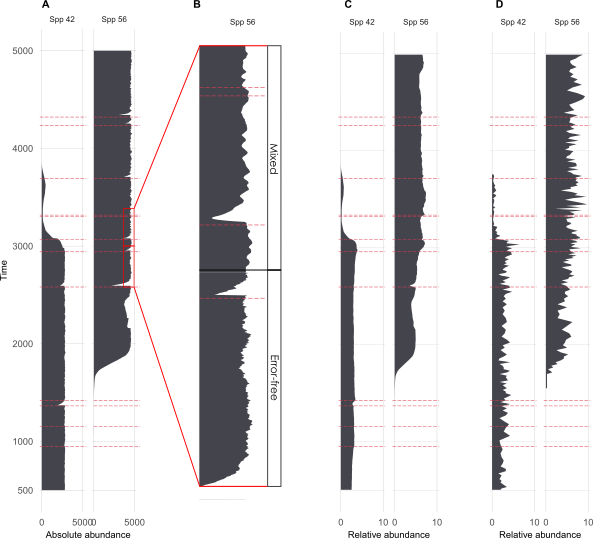
Ruining pseudoproxies
A. Example species from single replicate
B. Mixing
C. Mixing + sub-sampling
D. Mixing + sub-sampling + proxy counting
Ruined pseudoproxies
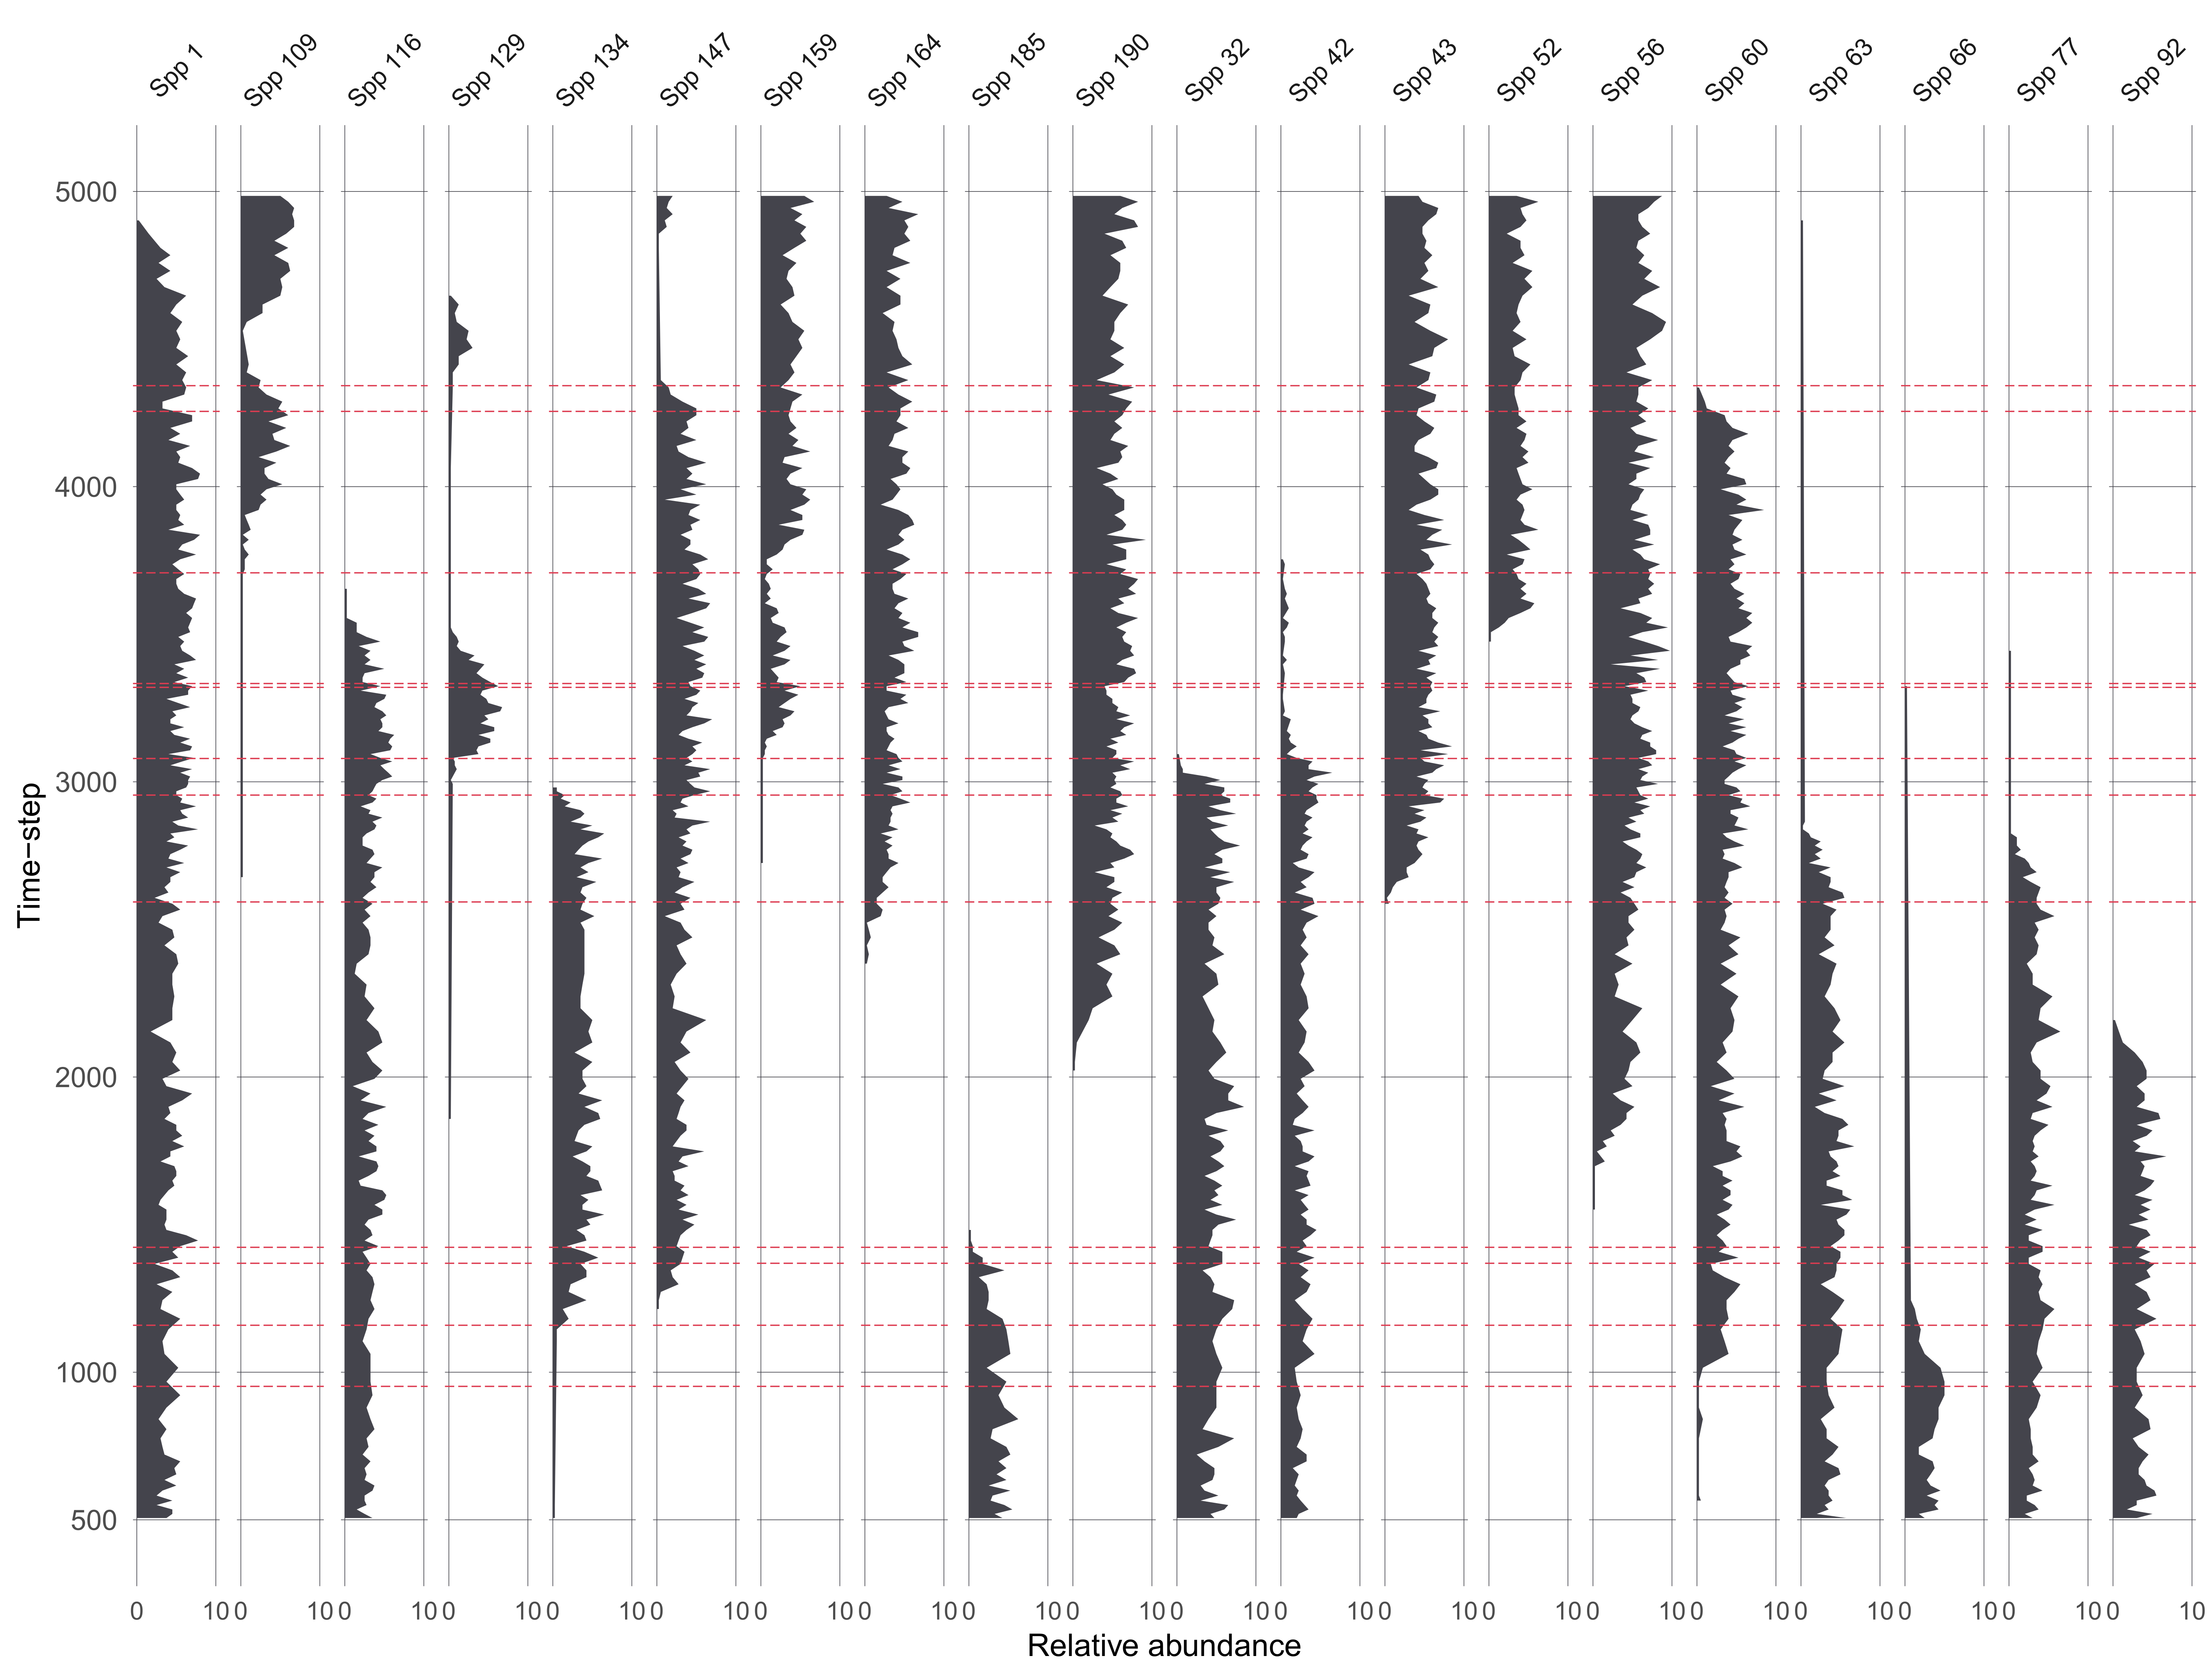
Scenario 1
Scenario 2
Assessing uncertainties across replicates
Each replicate results in 1210 datasets from the ‘error-free’ to the most uncertain, per scenario 😱.
Across replicates for each of the 1210 datasets:
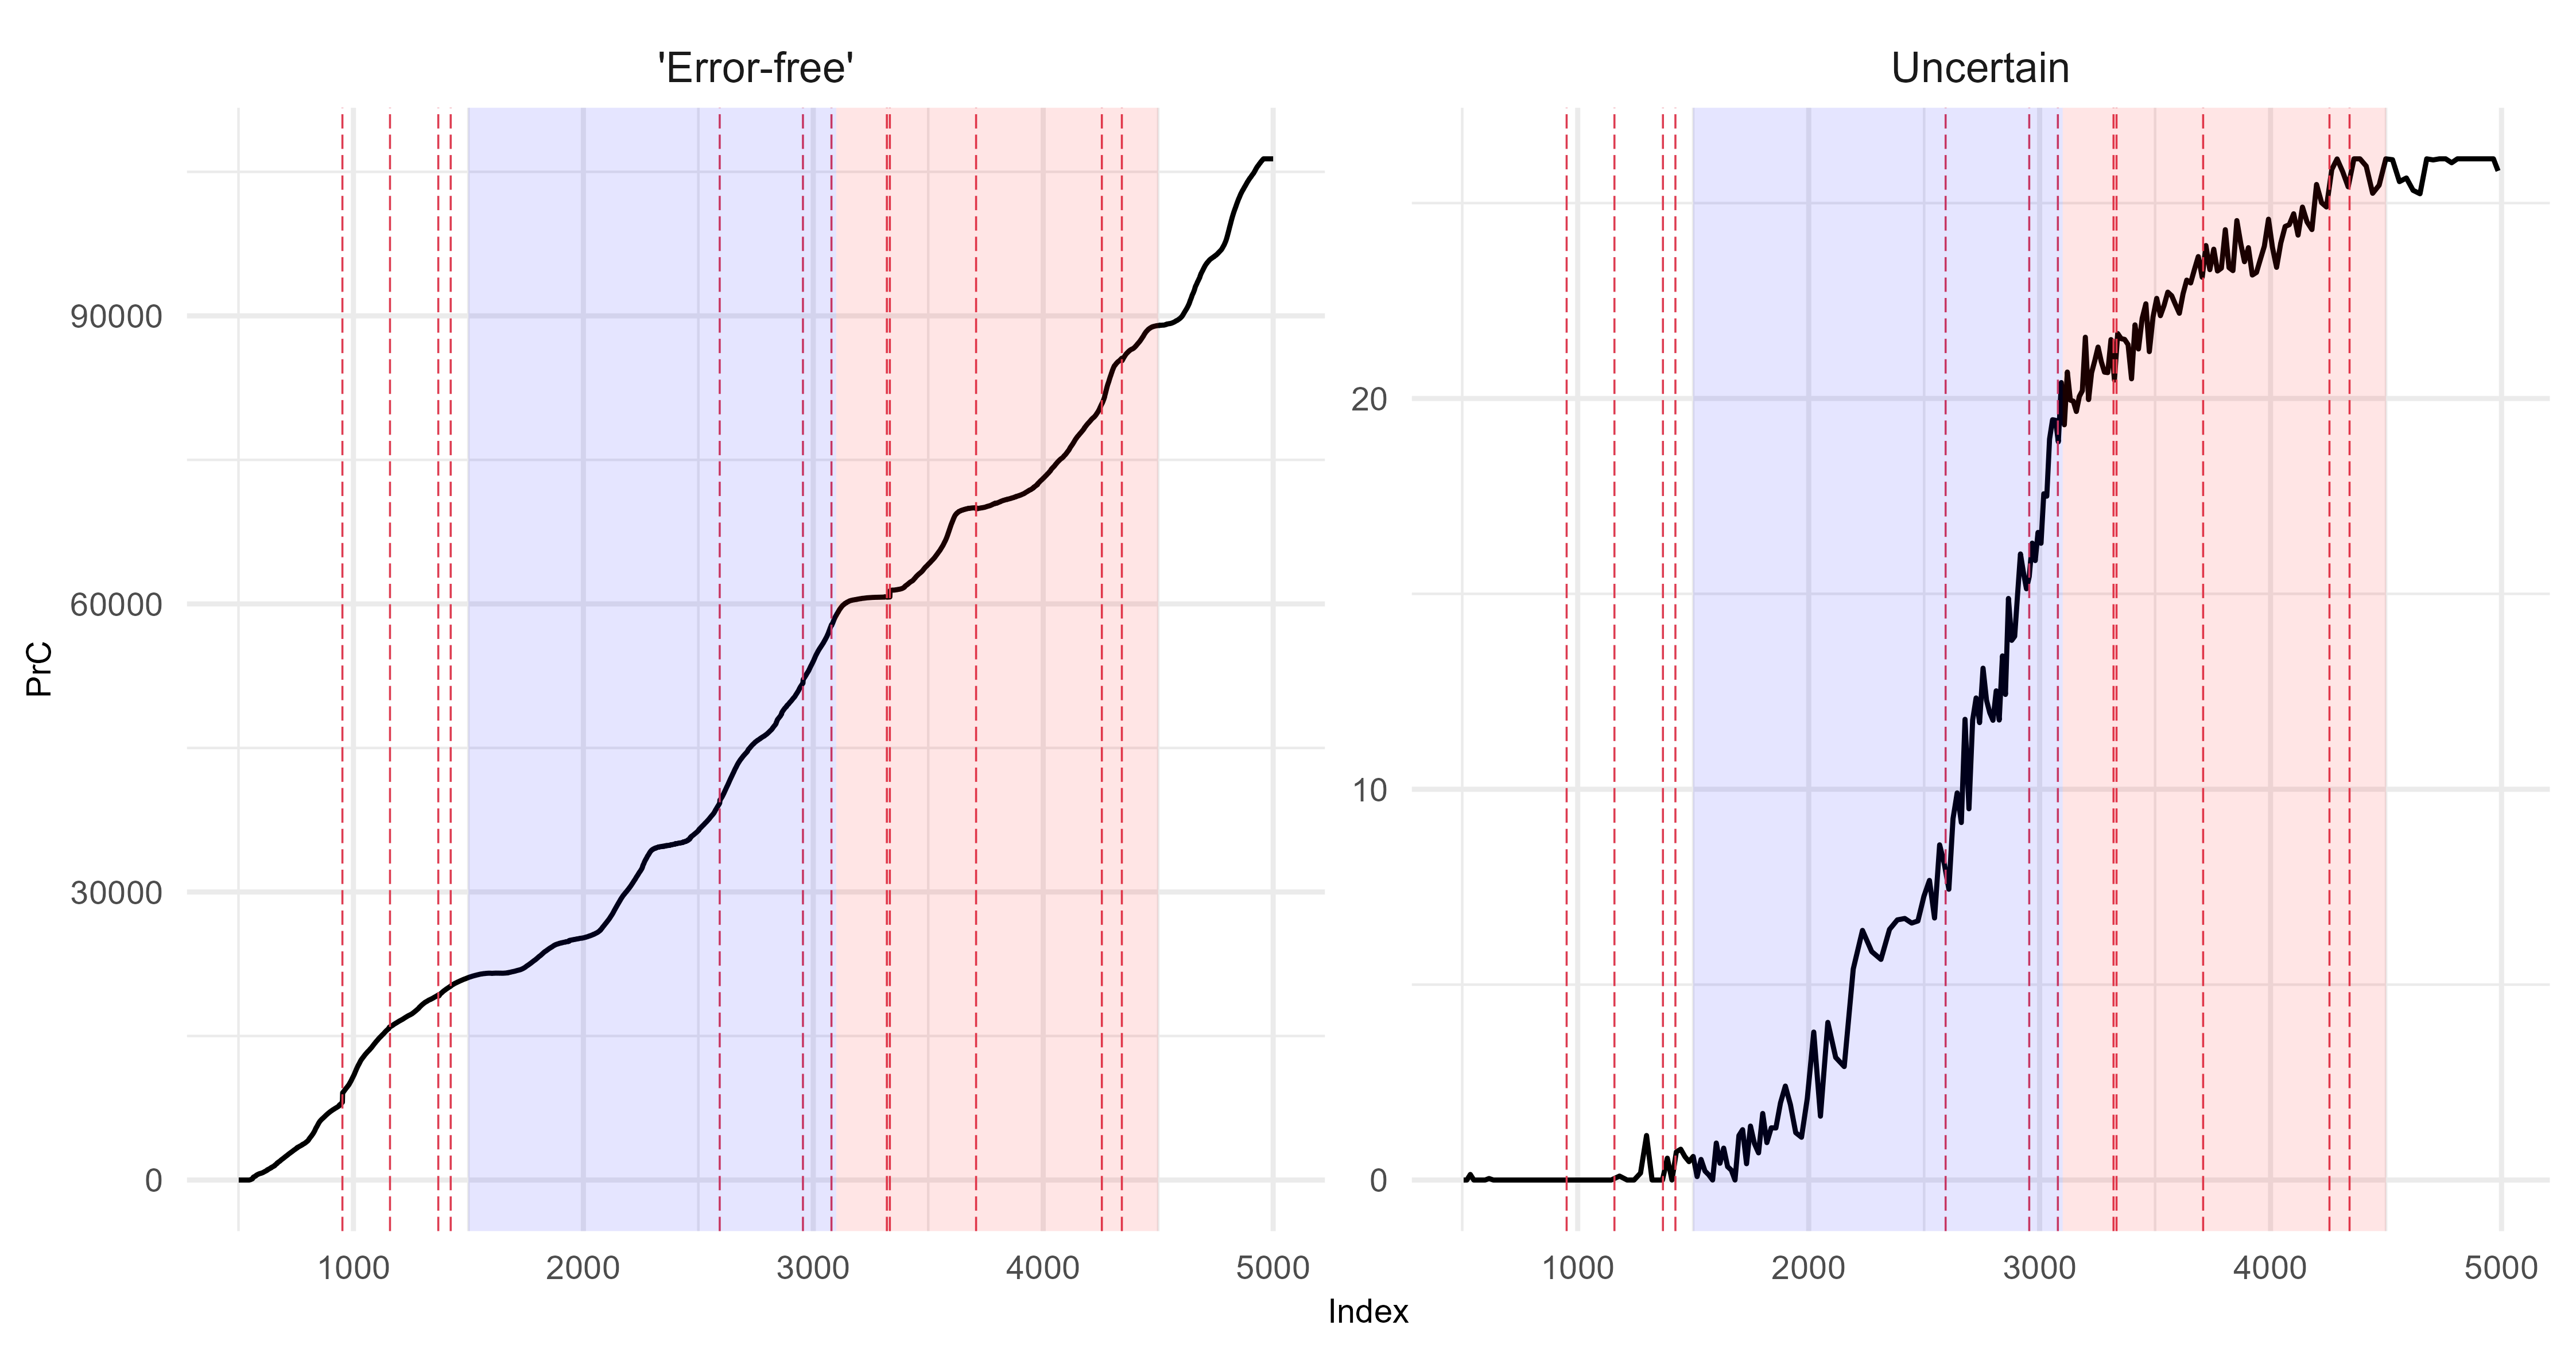
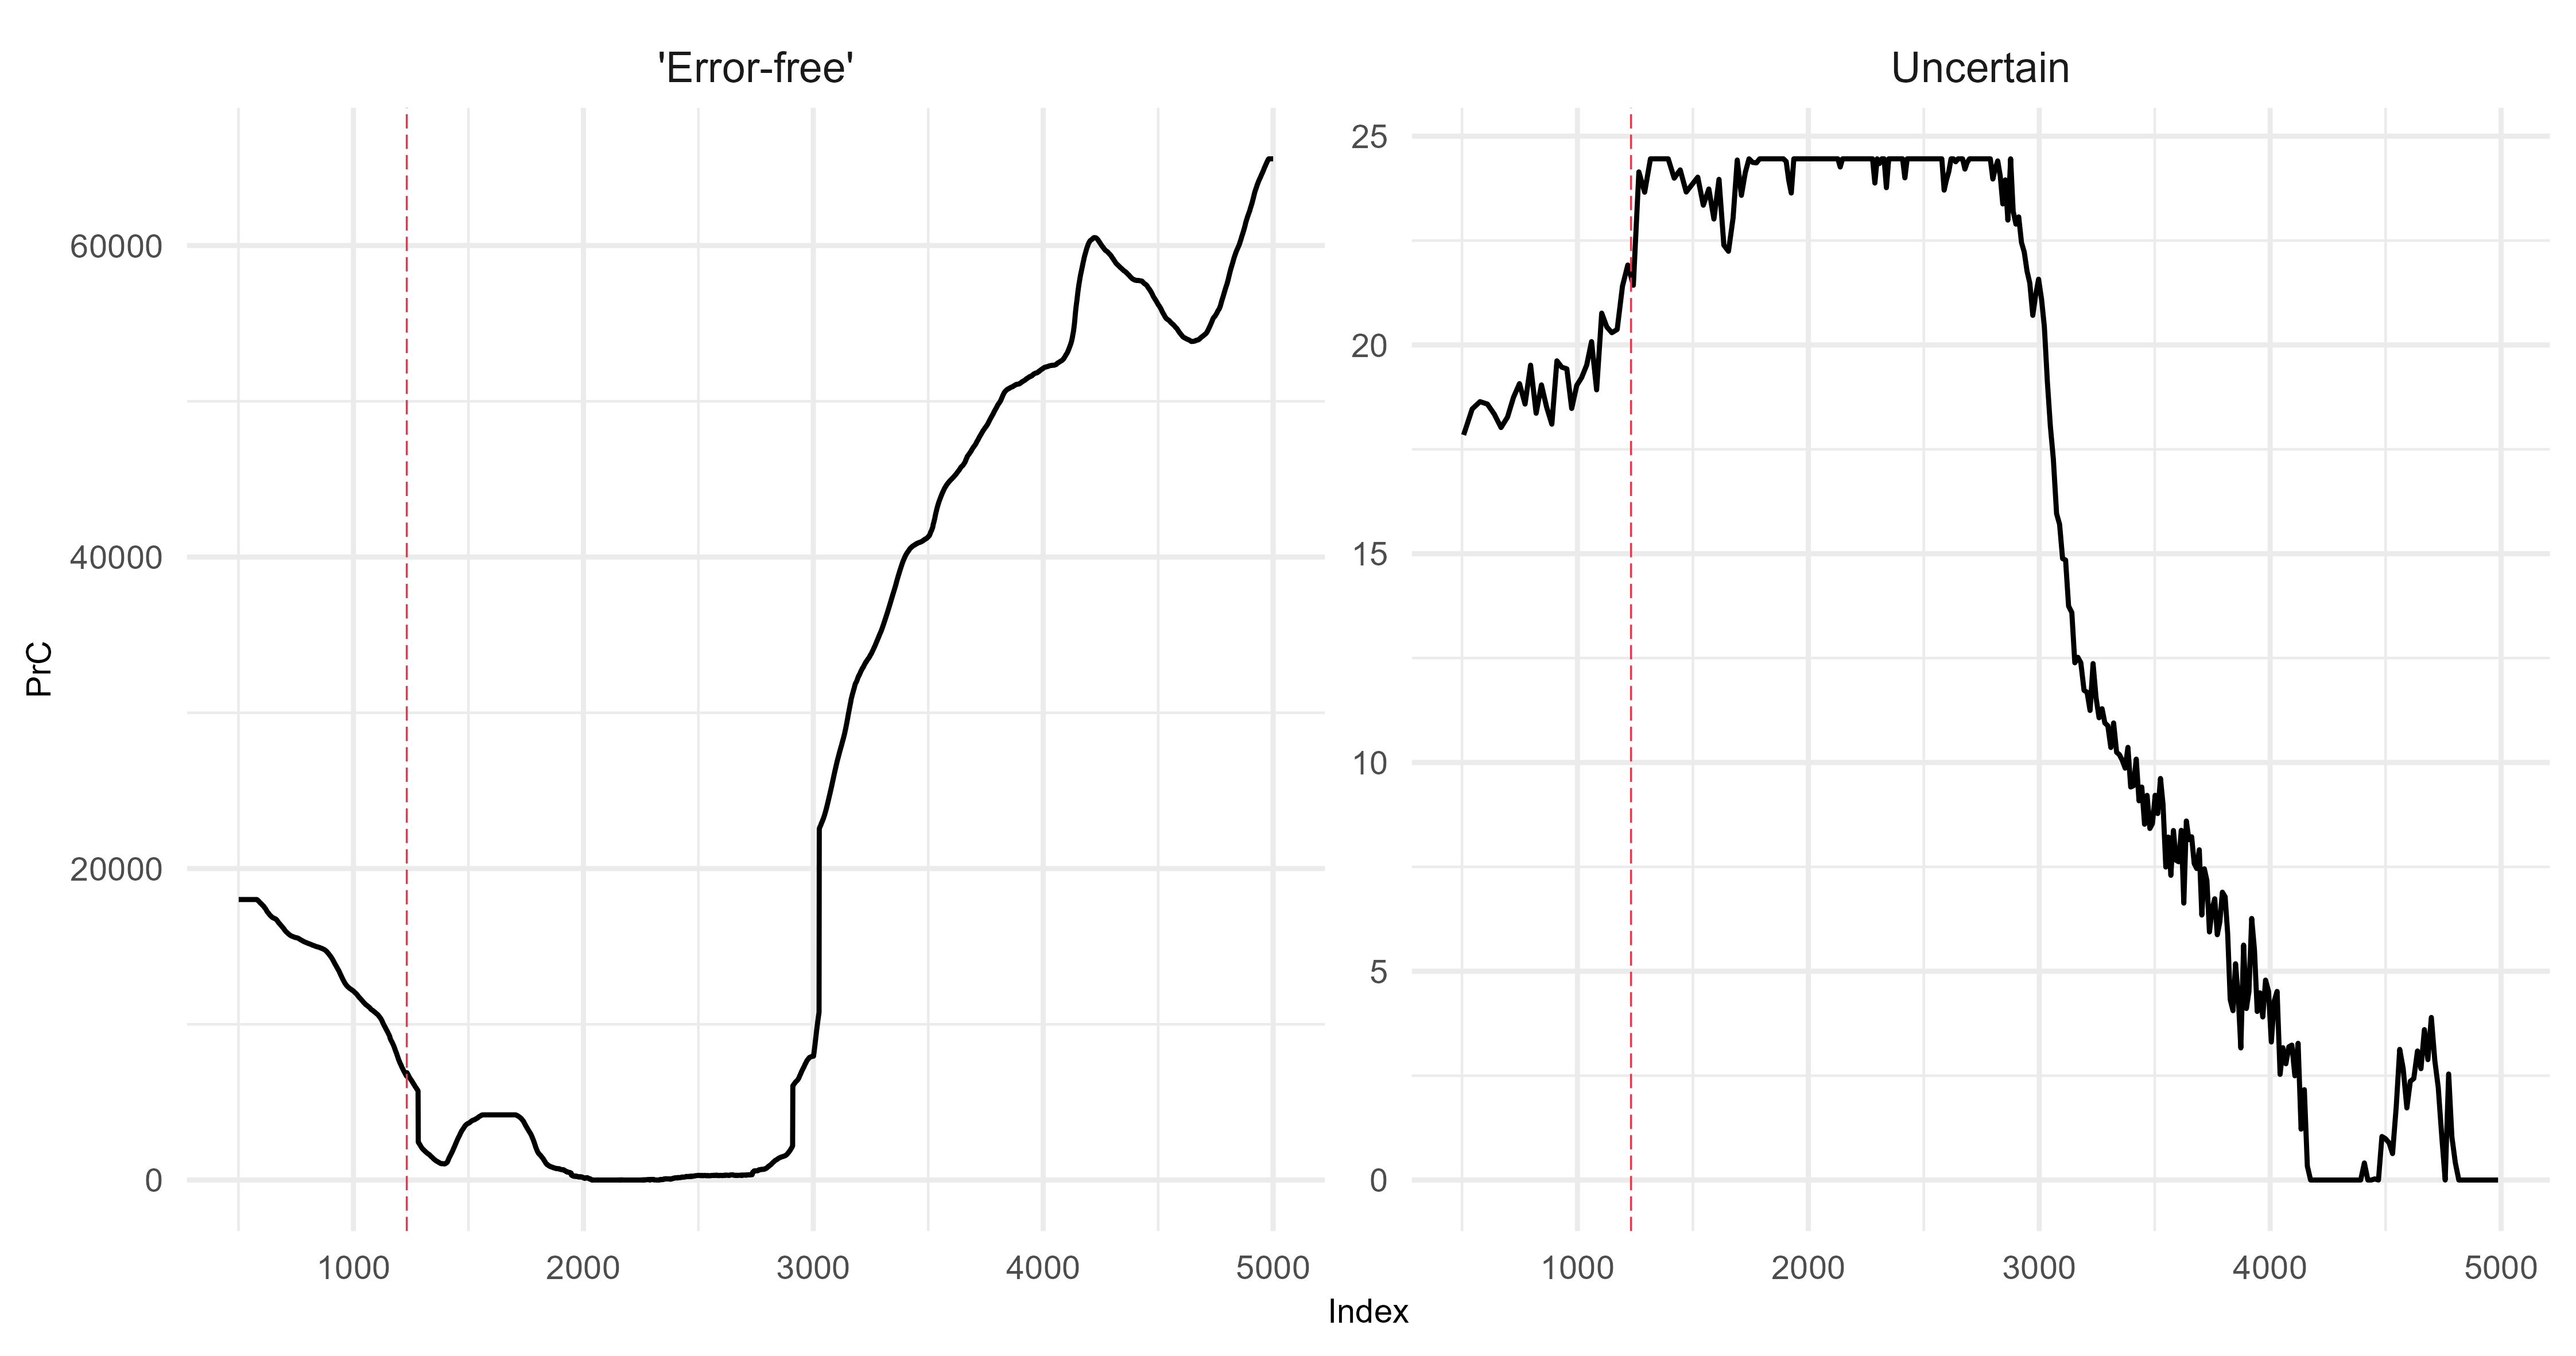
extract features from the FI and PrC
- feature analysis reduces the FI and PrC to one dimension
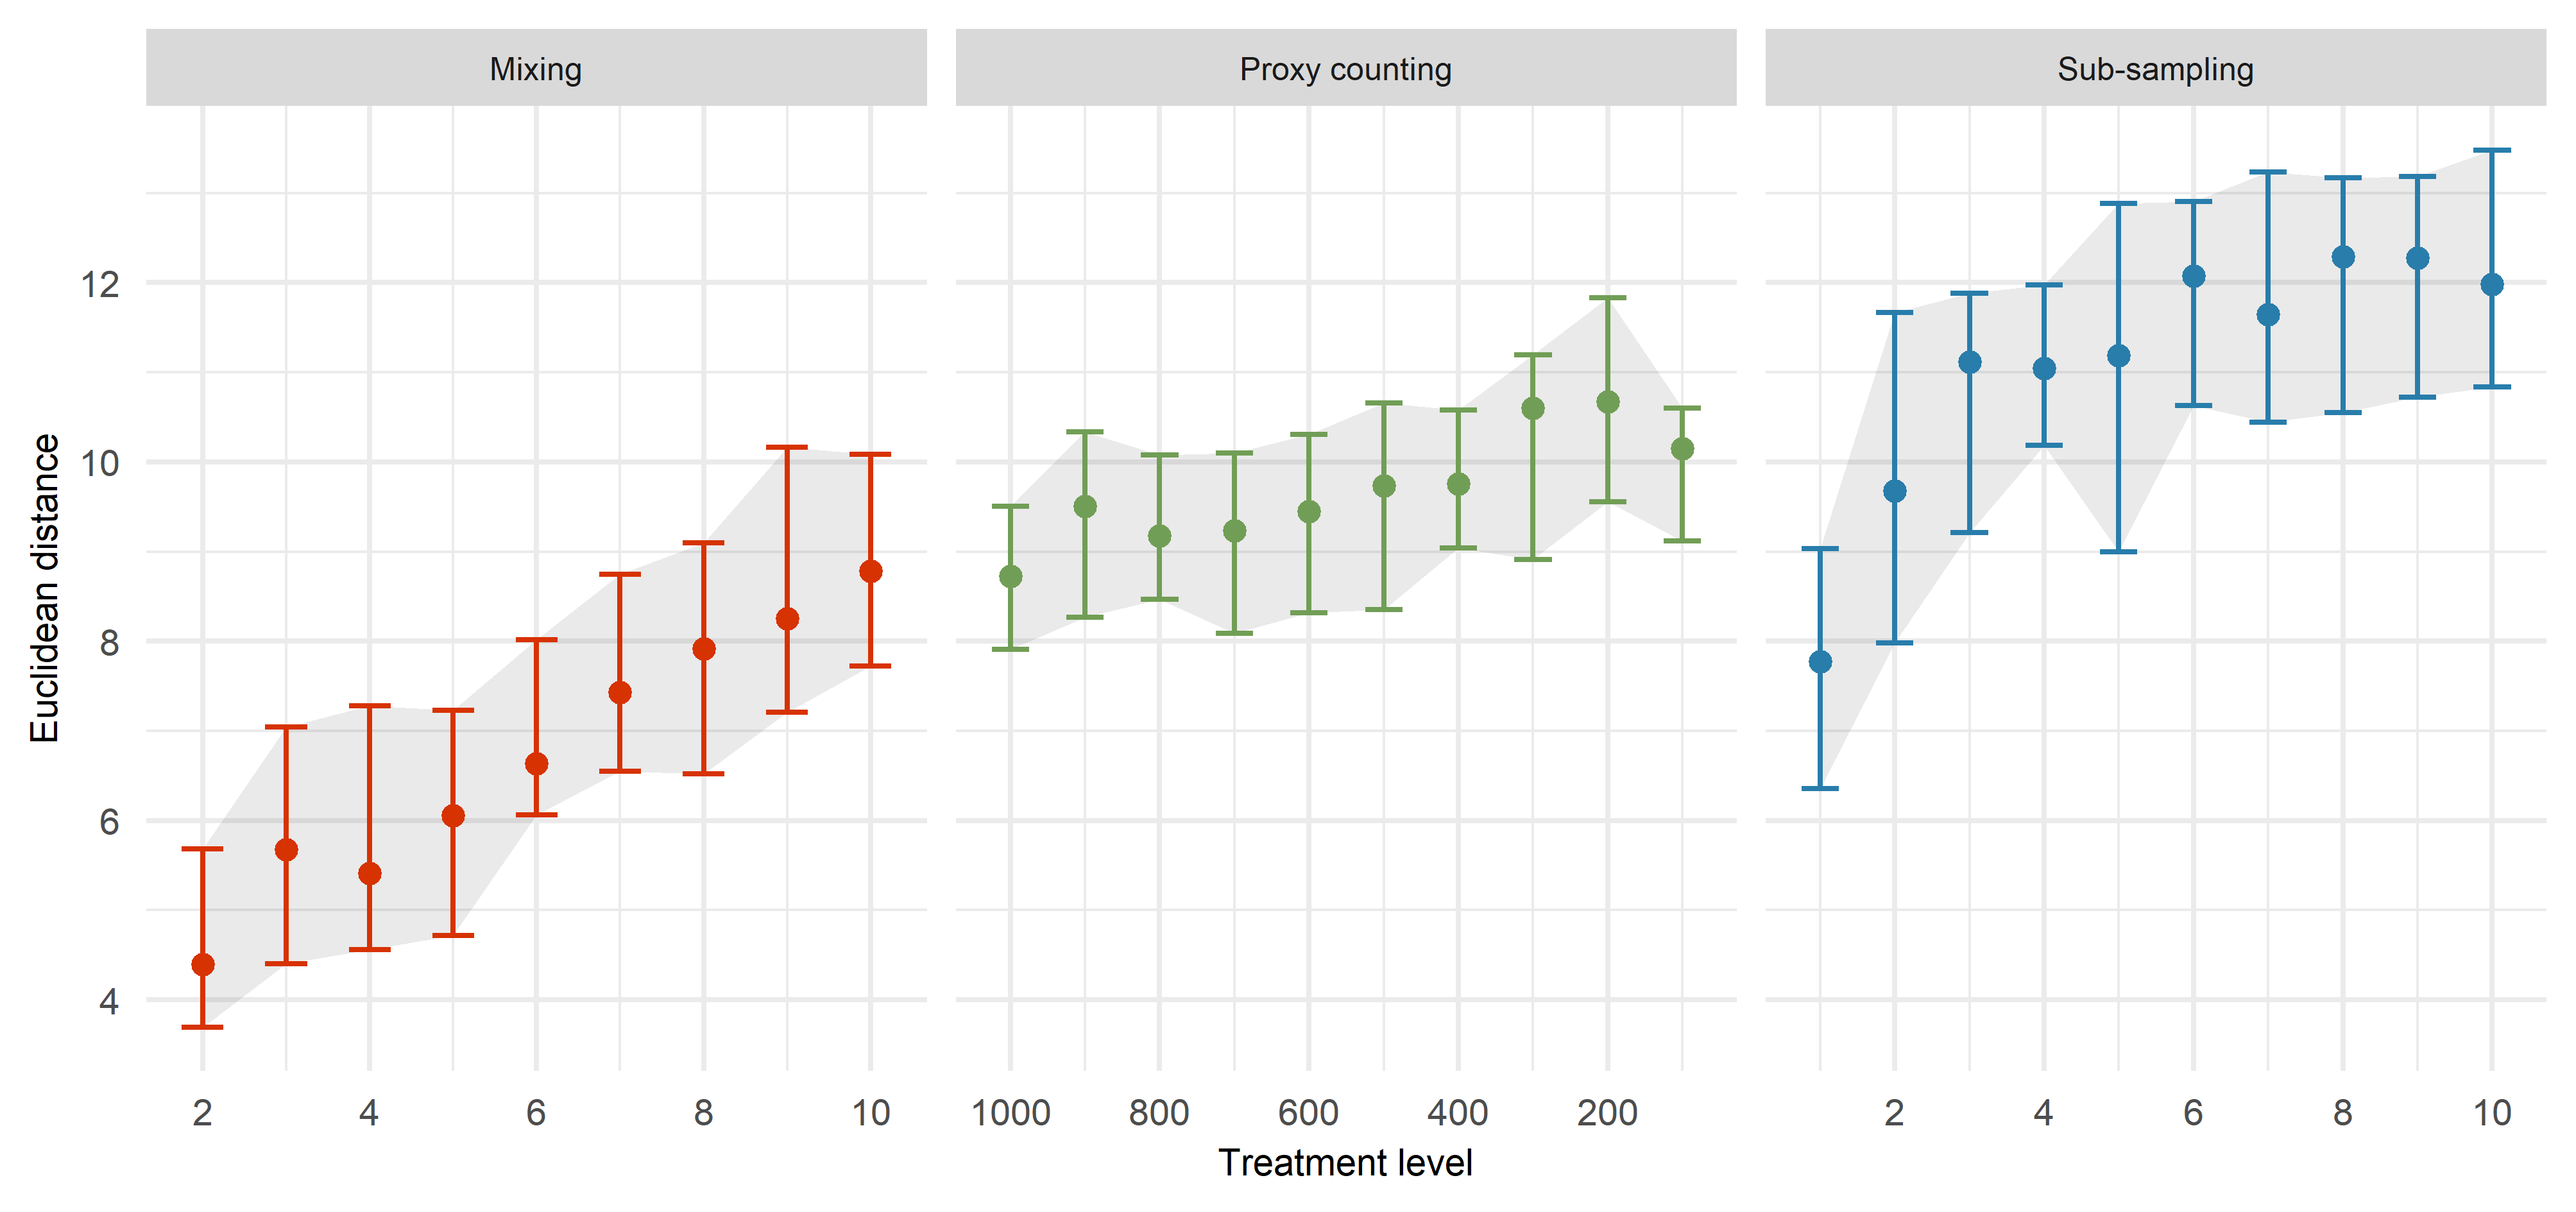
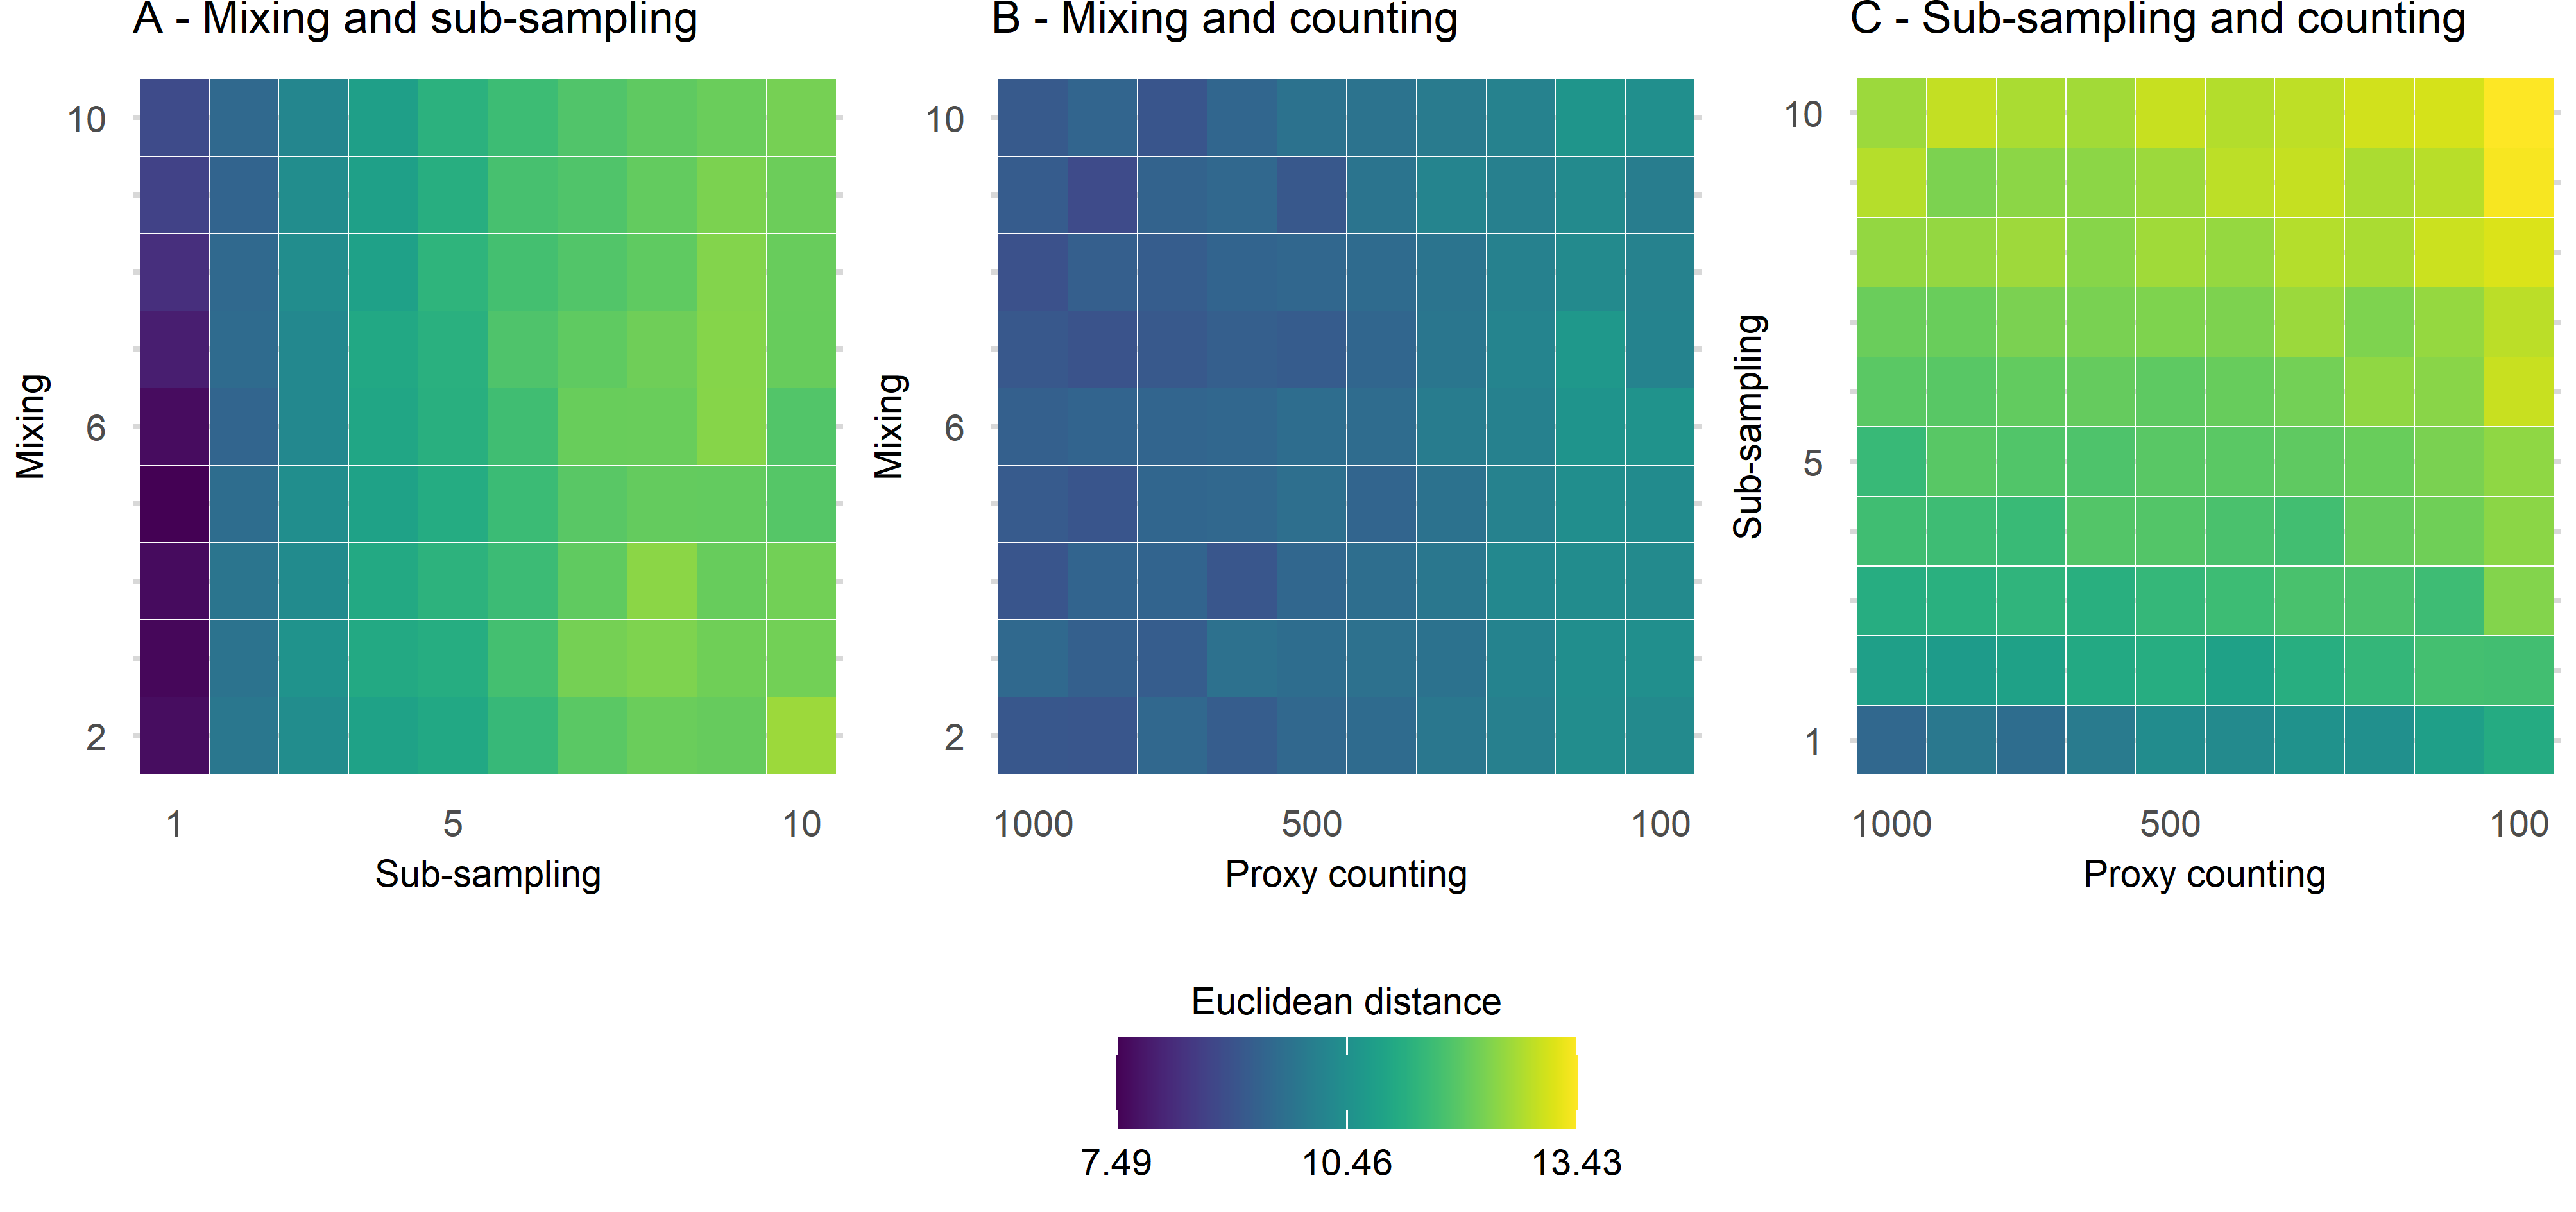
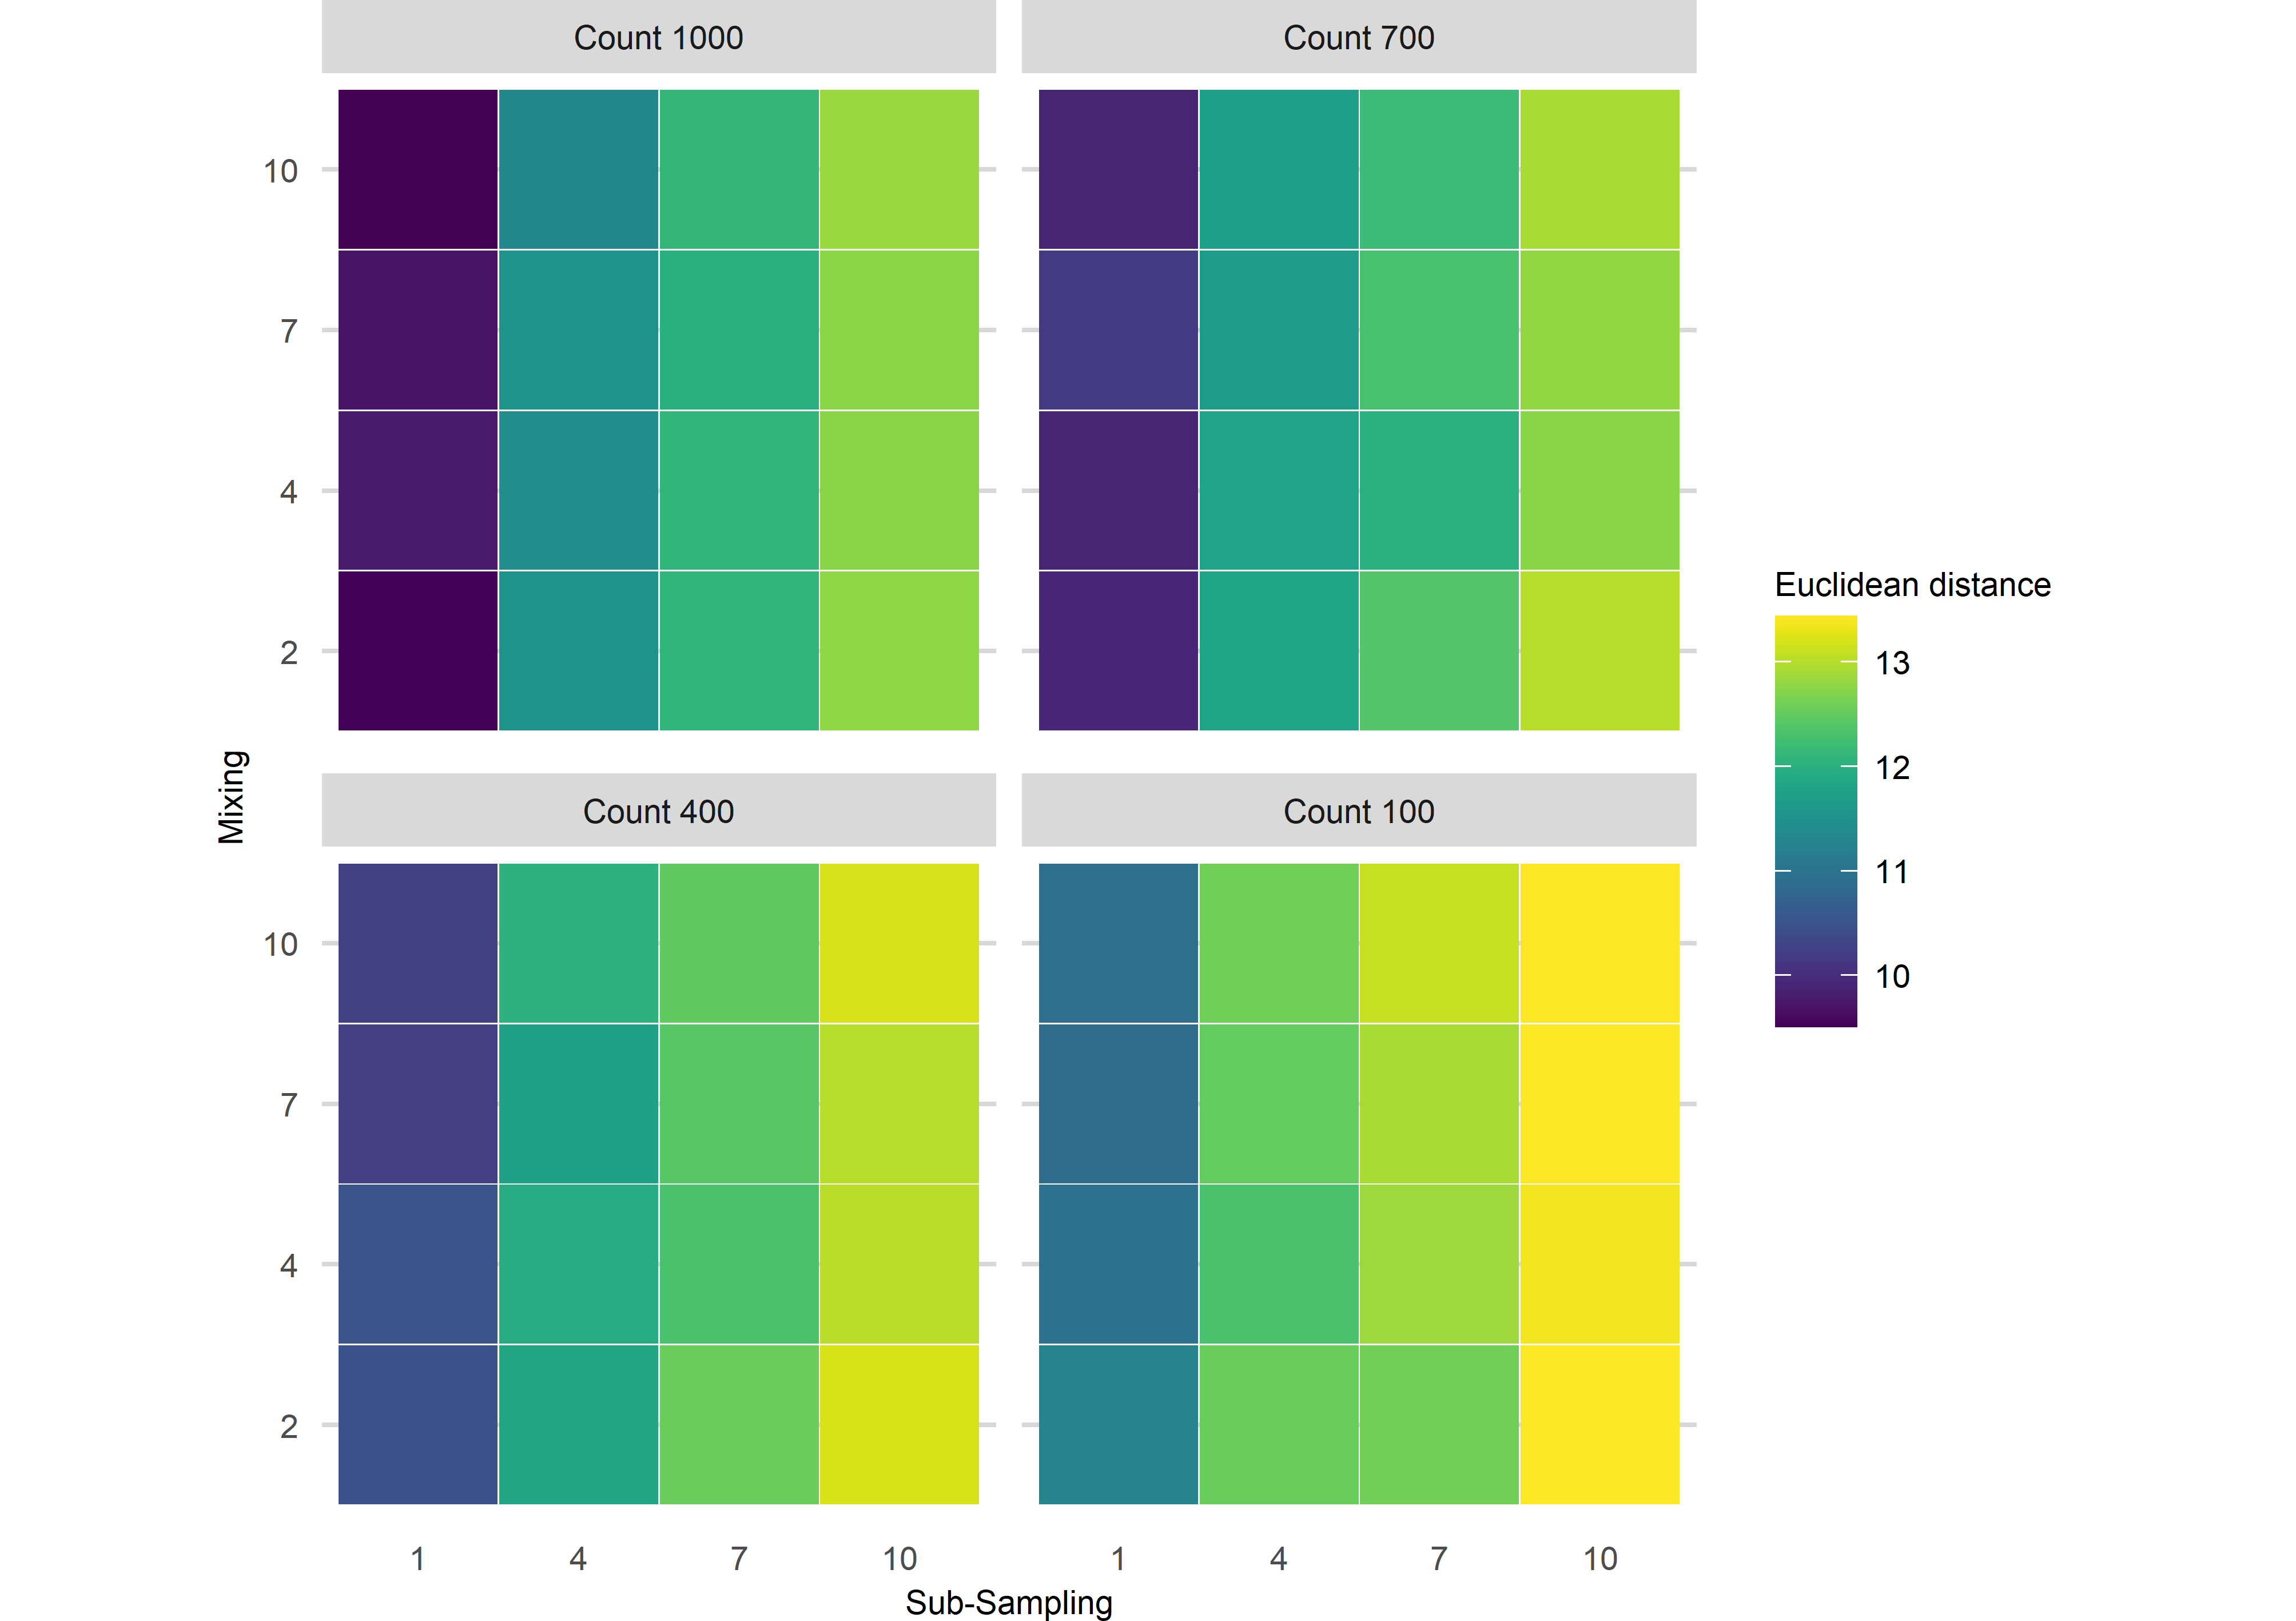
calculate the distance between each dataset from the ‘error-free’ to the most uncertain
make cool visulisations!
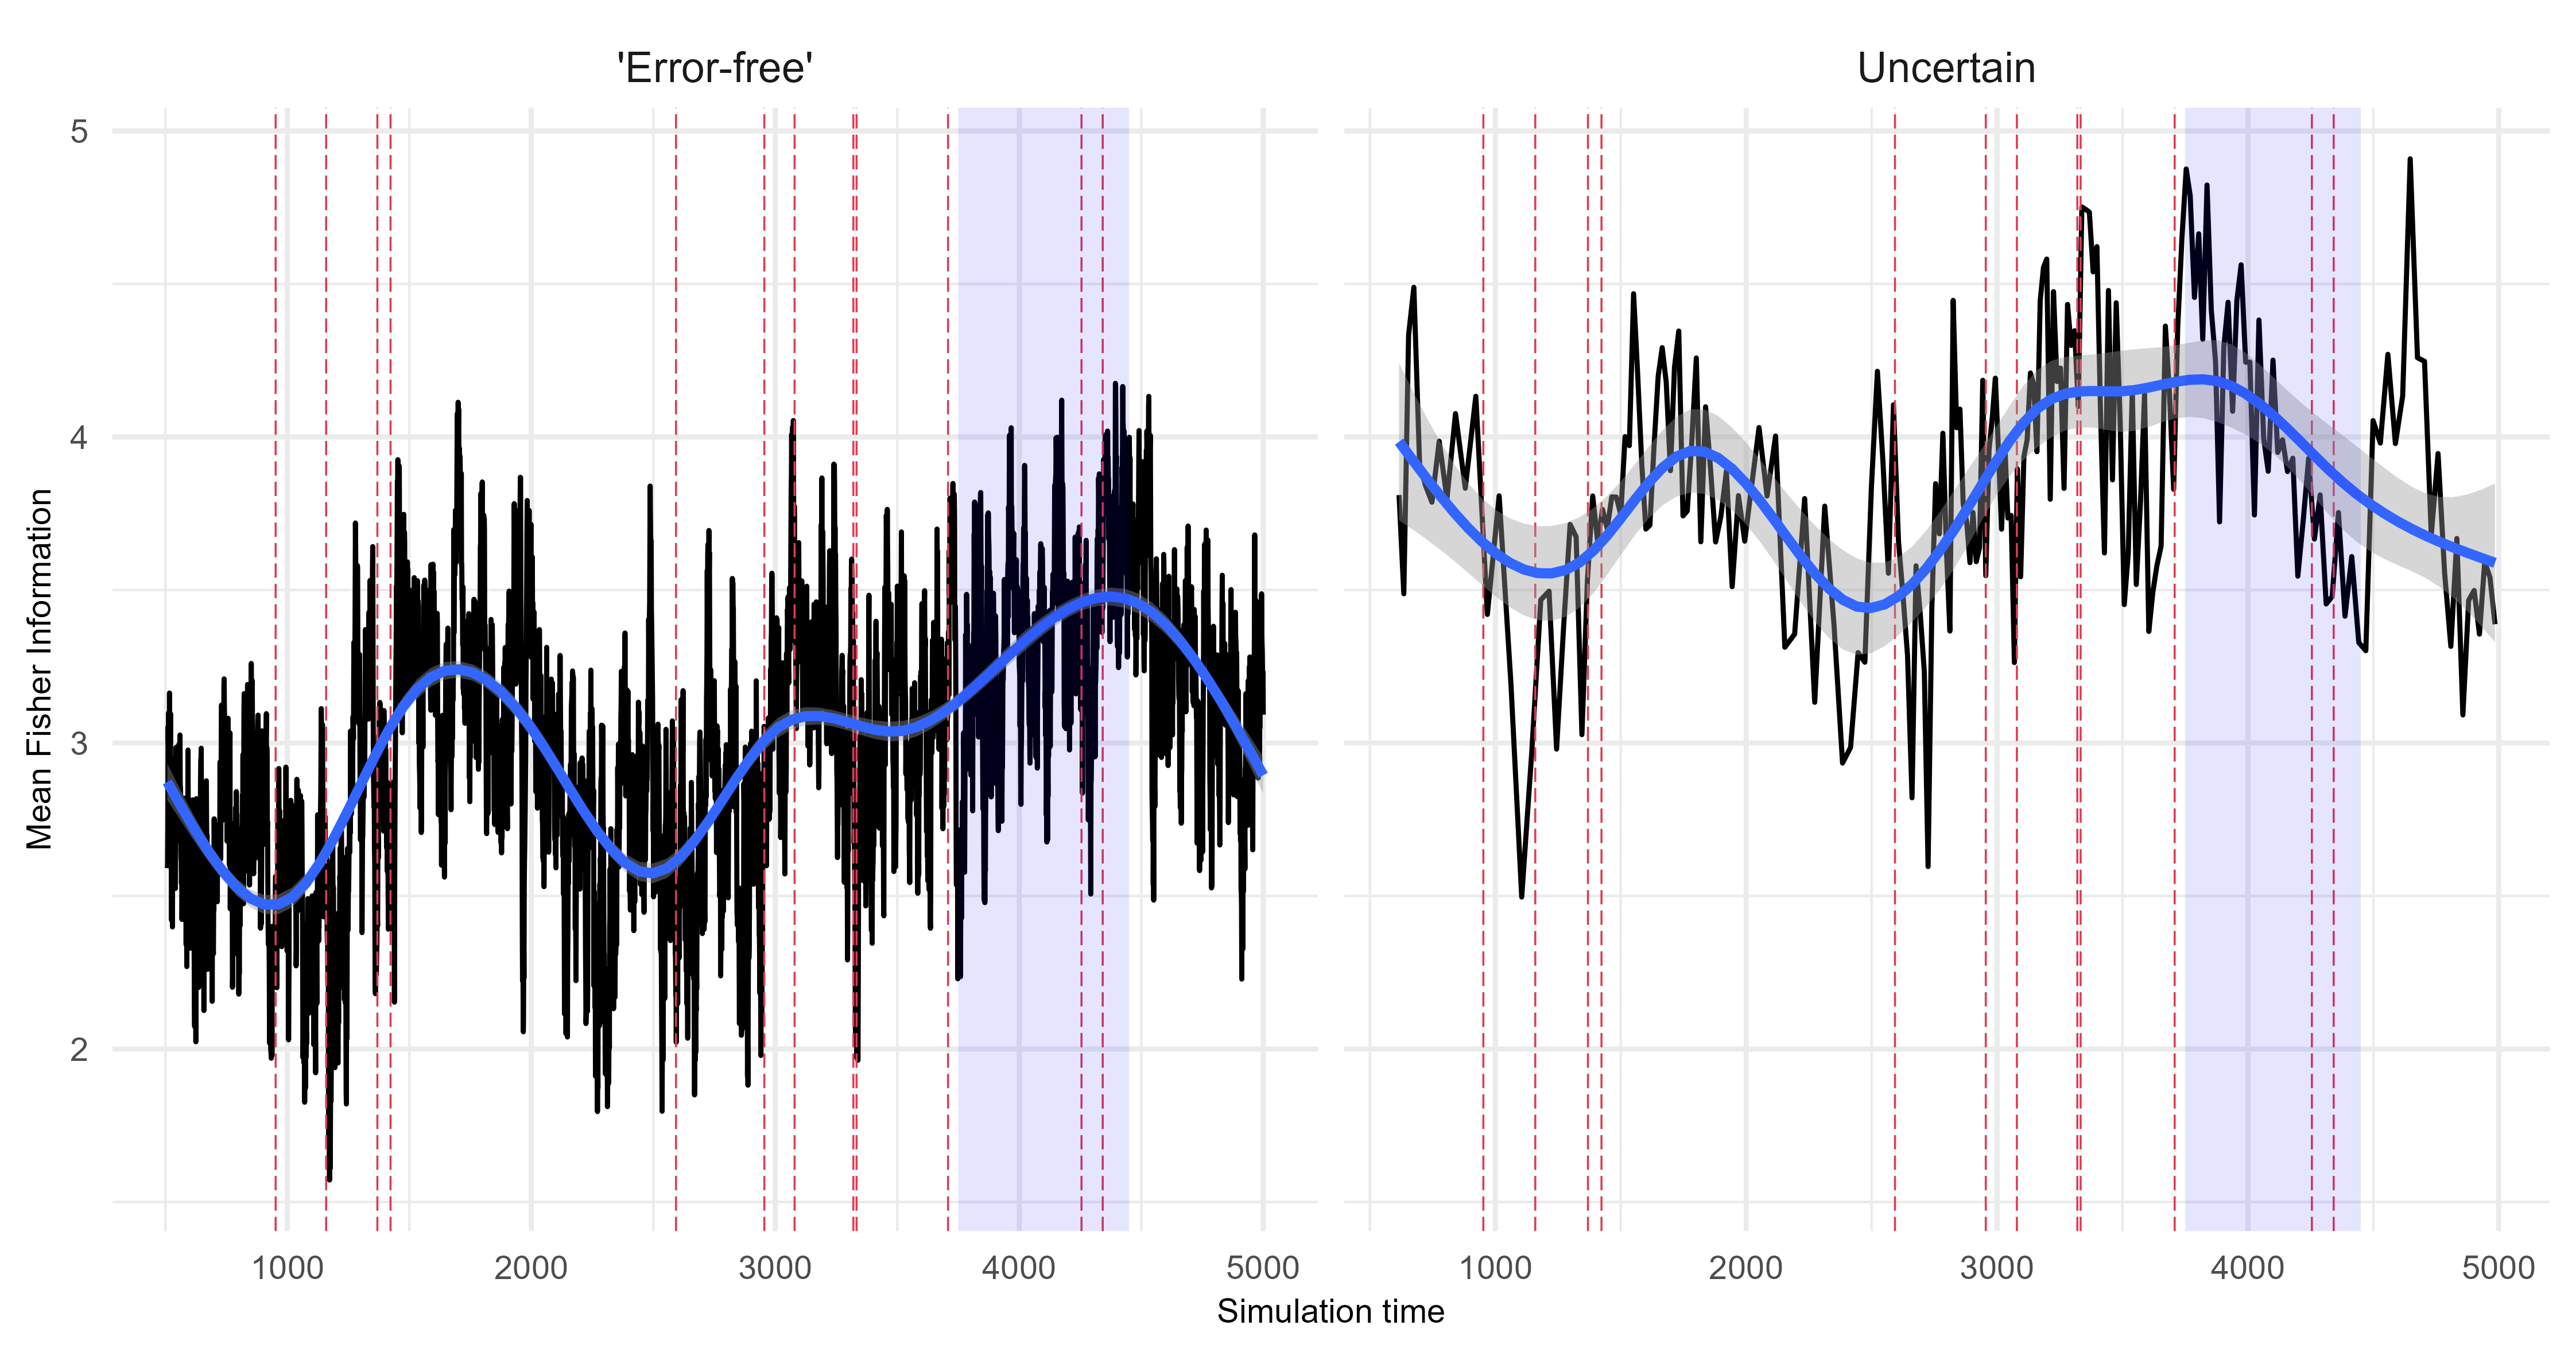
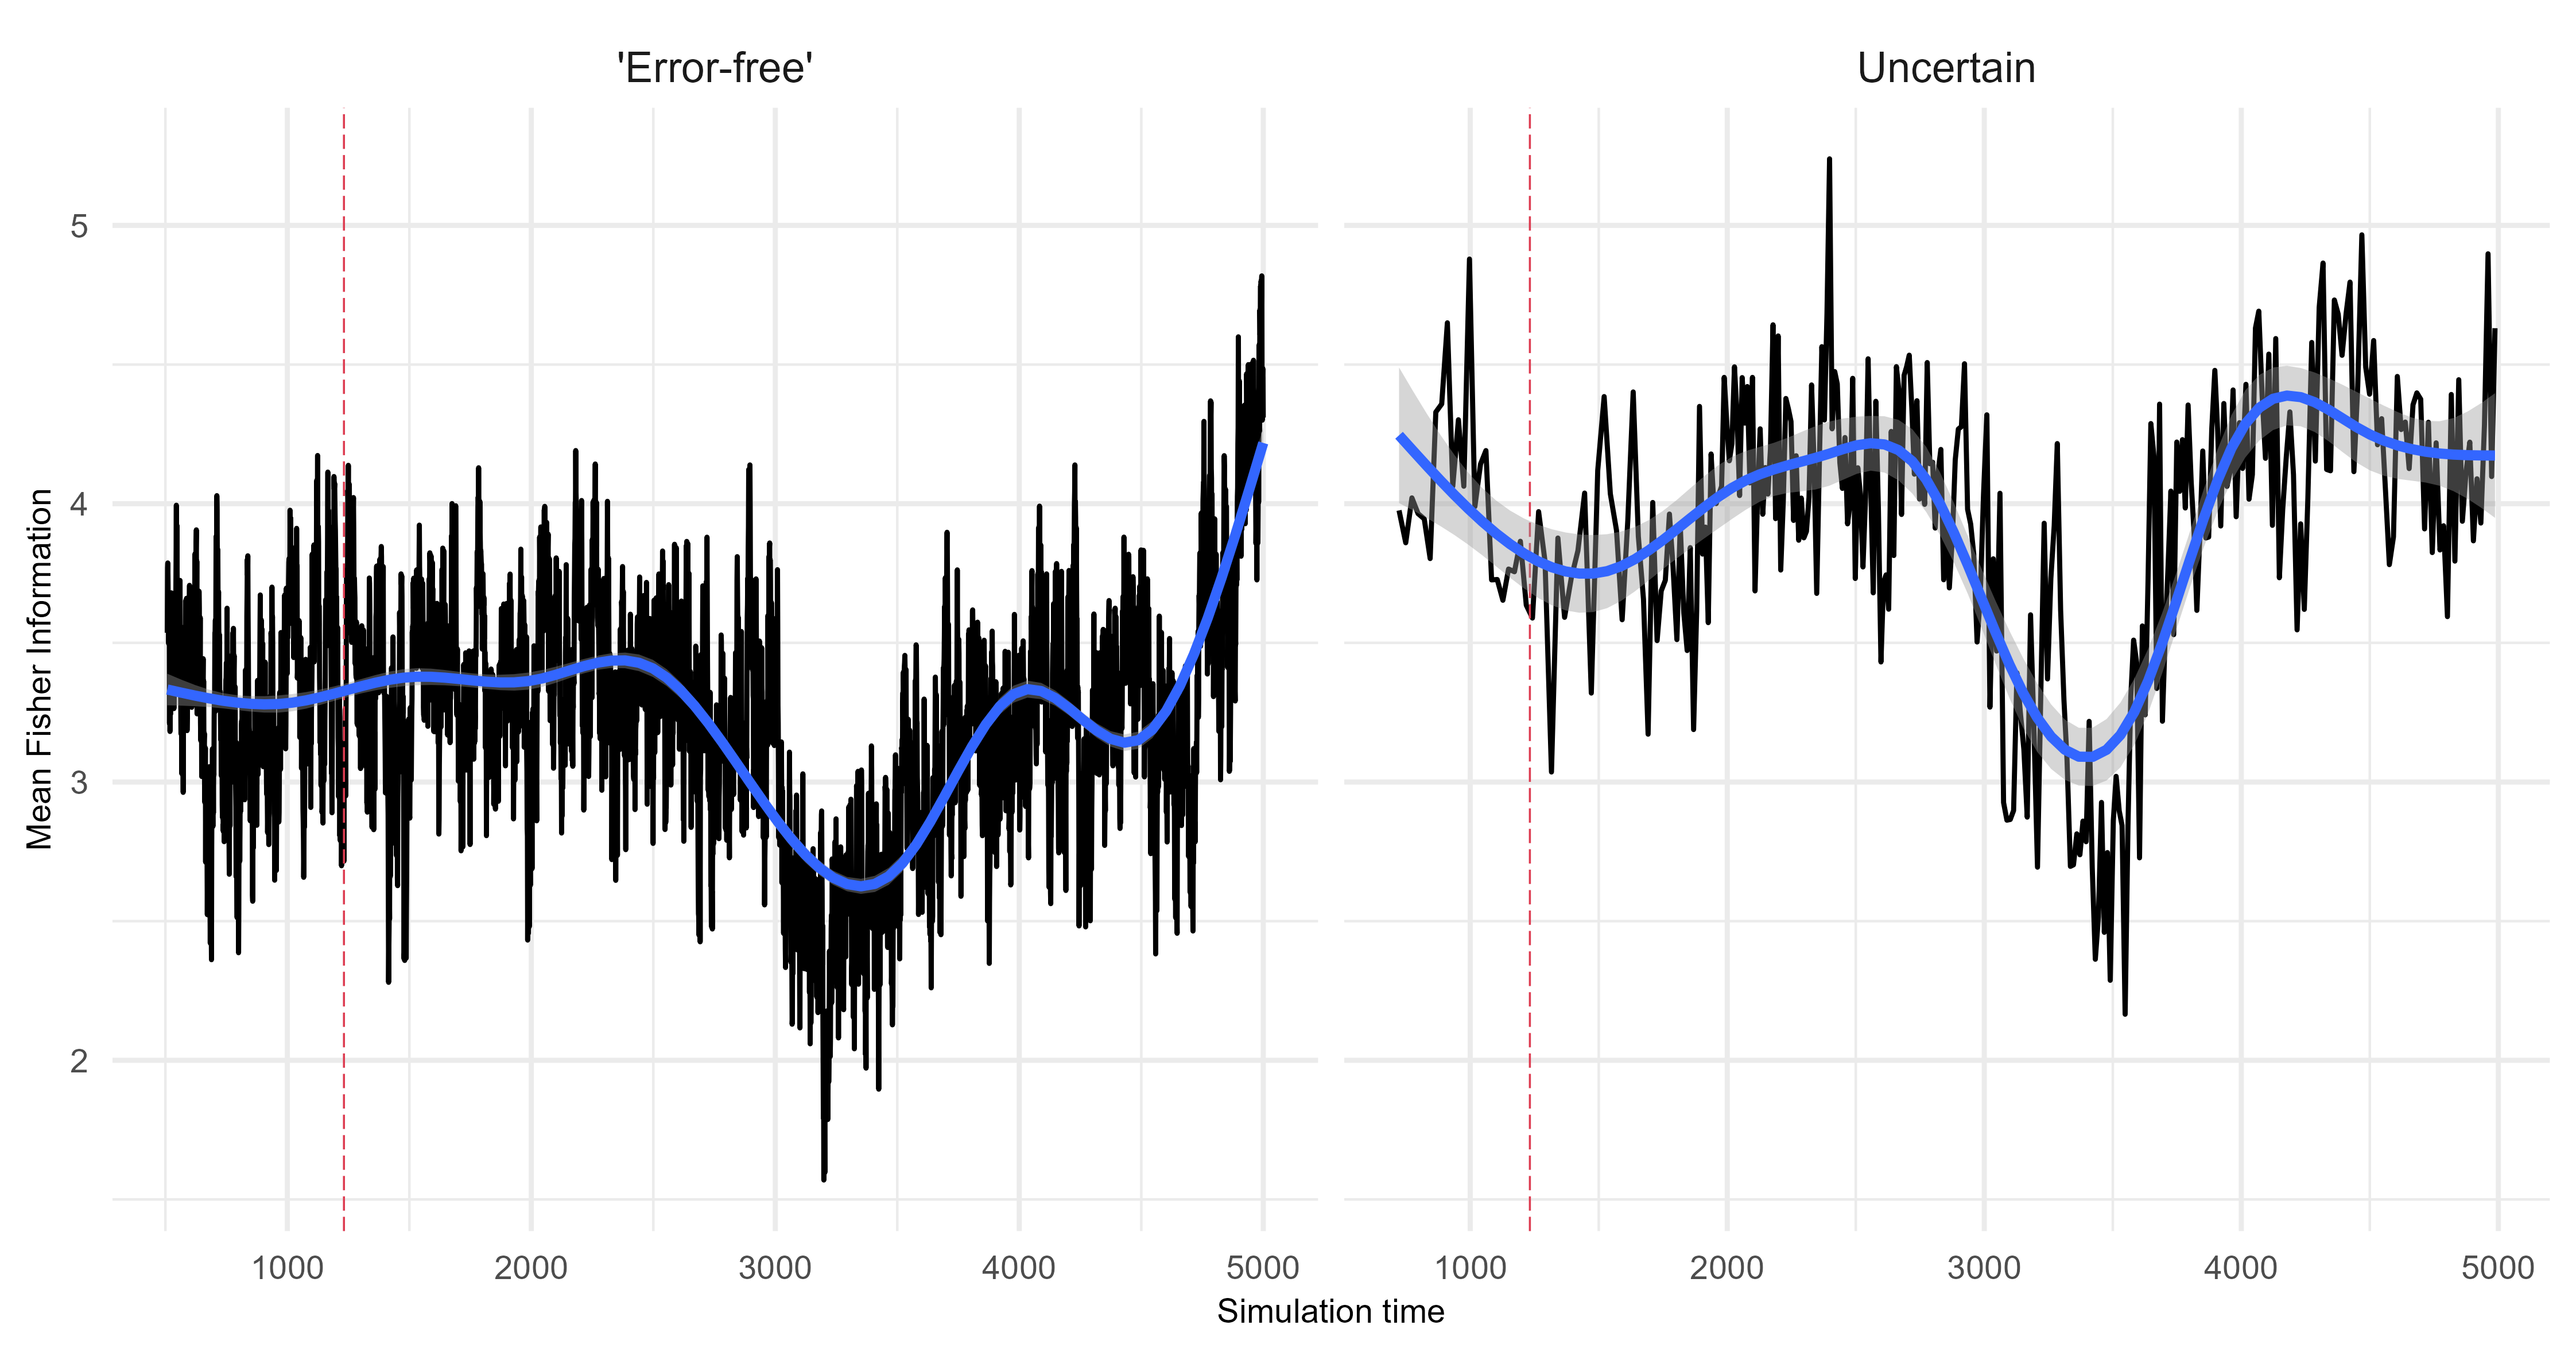
Assessing uncertainties across replicates
Quantify the difference between the ‘error-free’ archive and each level of uncertainty. The following is an example from scenario 1 using Fisher Information.